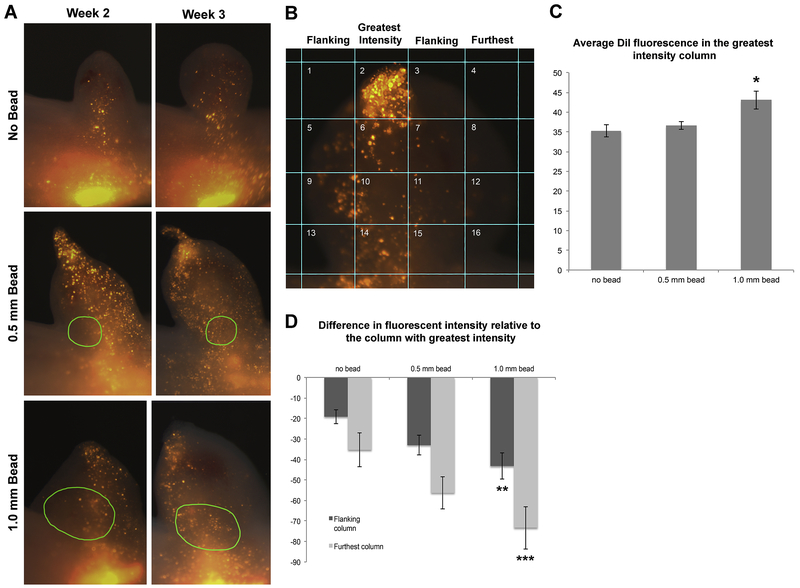
Figure 7: Size of implanted bead alters migration trajectory of dermal-derived blastemal cells.
(A) Representative images of DiI-labeled dermal cells that contribute to ectopic blastemas with no implanted bead (top panel), a 0.5 mm bead (middle), or a 1.0 mm bead (lower) at 2 and 3 weeks post-surgery. Green circles in middle and lower panels indicate the perimeter of the implanted beads that were visible via autofluorescence in the green channel. (B) The images of the blastemas were divided into 16 squares and the average fluorescence intensity of the blastema tissue in each square was measured. The column with the highest average intensity (second column in this example) (C) was compared with the average intensity of neighboring columns (flanking) and the columns farther away (furthest), and the average difference in intensity is presented in the histogram in panel (D). The y-axis in C and D corresponds to arbitrary fluorescent units. N = 13 blastemas measured for the no bead samples; N = 16 for 0.5 mm samples, and N = 12 for 1.0 mm bead samples. Error bars are SEM, and one-way ANOVA and post-hoc Turkey tests for significance were performed (* p = 0.04 comparing no bead to 1.0 mm bead; ** p = 0.01 comparing flanking columns between no bead and 1.0 mm bead, and *** p=0.003 comparing furthest column in the no bead compared to the 1.0 mm bead samples).

