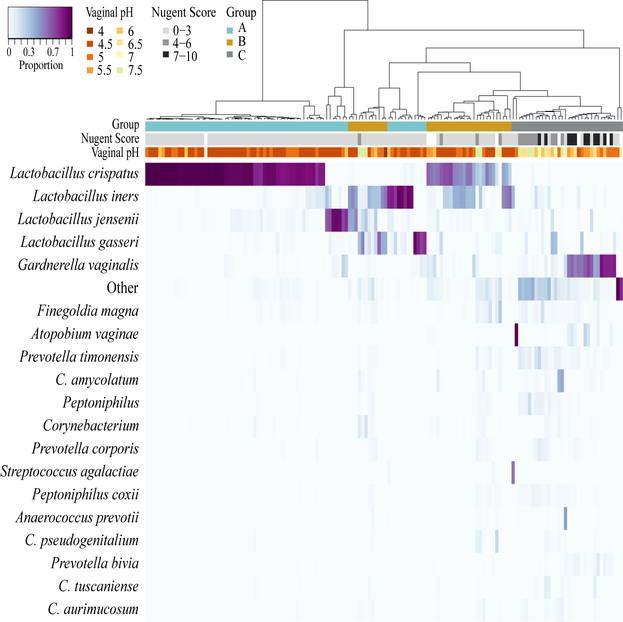
Figure 1. Heatmap based on the relative proportions of the 20 most abundant taxa in vaginal communities of Black adolescent women.
The columns of the heatmap include 146 samples collected from 21 young women over a 6-month period. The corresponding dendrogram represents complete-linkage hierarchical clustering of samples based on alt-Gower distances. The colored bar immediately below the dendrogram indicates which clusters were combined to form three groups (A, B, and C).

