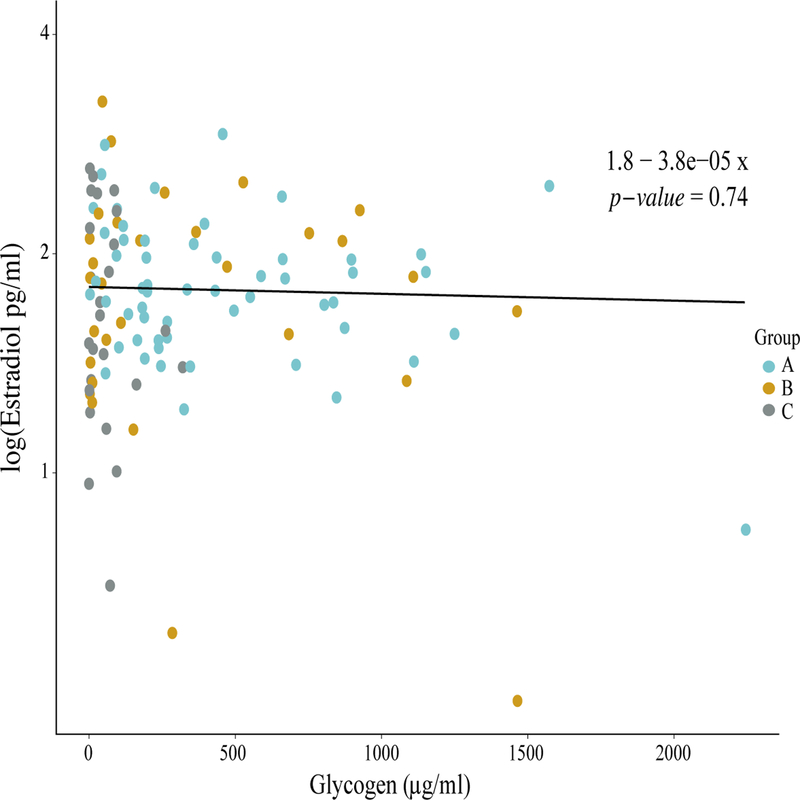
Figure 4. The relationship between log-transformed estradiol and glycogen concentrations in Black adolescent women sampled longitudinally.
The amounts of salivary estradiol in each sample were log-transformed and modeled over corresponding glycogen measurements including subject as a random effect. The resulting linear model equation and p-value (shown in the upper right corner) were obtained by computing an analysis of variance (ANOVA) on the linear model. Each dot represents the log estrogen concentration and the corresponding glycogen value for a given sample. Dots are colored according to community group as shown in the legend to the right of the graph.

