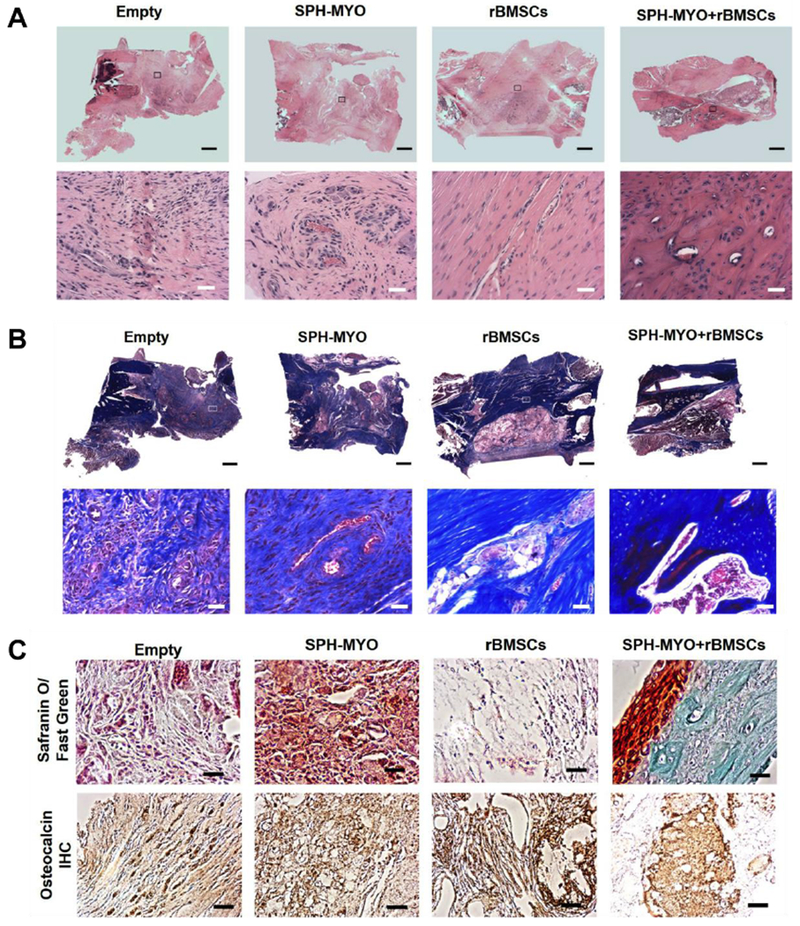
Figure 7. Histological analysis of regenerated bone tissue.

(A) Hematoxylin and Eosin (H&E) staining of tissue at the defect site reveals more dense, organized tissue in defects treated with SPH-MYO + rBMSCs. Top images are the entire section, while images below are insets at 20× magnification. (B) Masson’s Trichrome staining with large scan on top and inset images below at 20× magnification reveals more intense collagen staining in SPH-MYO + rBMSCs compared to other groups. (C) 20× magnification images of Safranin O/Fast Green- and osteocalcin-stained sections. Scale bar in large scan is 1 mm; scale bar in 20× images is 50 μm.
