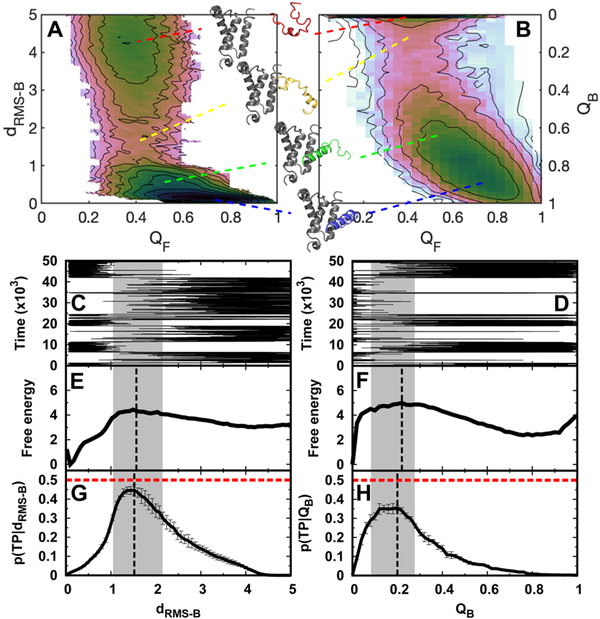
Fig. 1. Trajectories, transition path analyses, and free energy landscapes of binding-coupled-folding of pKID to KIX.
2D binding–folding free energy landscapes are calculated from REMD simulations and projected along (A) dRMS−B, QF and (B) QB, QF. dRMS−B is the root-meansquare deviation of the distances of binding native contact pairs to those in the native structure, while QB and QF are the fractions of binding and folding native contacts for pKID, respectively. The typical structures of pKID-KIX are shown corresponding to the indicated binding stages. A sample binding trajectory (C, D), 1D free energy landscape (E, F), and transition path analyses (G, H) are shown along dRMS−B and QB, respectively. p(TP|x) is the conditional probability of being on a transition path, where x is the reaction coordinate. The dashed vertical lines in free energy landscapes and p(TP|x) are plotted according to the maximum values as an identification of the transition state. The values at the peak of p(TP|x) for dRMS−B and QB are 0.45±0.03 and 0.35±0.01, respectively. The transition state locations are very similar, according to different identifications of the barrier of free energy landscapes and the peak of p(TP|x). In detail, for dRMS−B, the transition states’ dRMS−B are 1.49 and 1.52 from the free energy landscape and p(TP|x), respectively, while for QB, the transition states’ QB are 0.22 and 0.20 from the free energy landscape and p(TP|x), respectively. We denote the transition state ensembles that have p(TP|x) higher than 0.30 by gray shadow regions. The errors of p(TP|x) are calculated by analyzing different trajectories. A total of 1108 and 1099 (un)binding transition paths are observed along dRMS−B and Q, respectively. Time is in reduced units, dRMS−B is in units of nm, and free energy is in units of kTB, where TB is the binding temperature.

