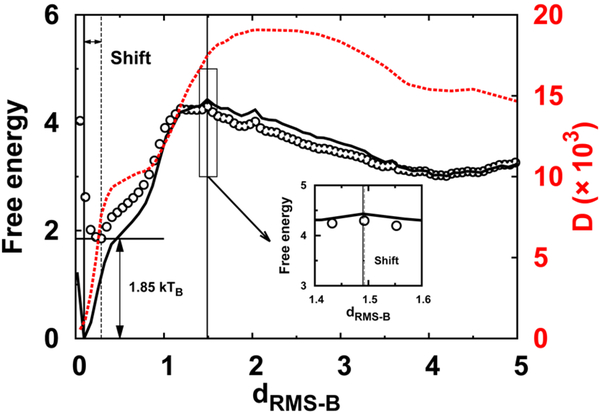
Fig. 2. Position-dependent diffusion coefficient and free energy landscapes.
1D binding thermodynamic (solid line), effective (circles) free energy landscapes, and the diffusion coefficient D are plotted along dRMS−B. The insert plot indicates the slight height and position shift of the transition state between the thermodynamic and effective free energy landscapes. The free energy landscape is obtained from thermodynamic REMD simulations, and D is calculated from restraining simulations, at constant binding temperature. dRMS−B is in units of nm, and free energy is in units of kTB, where TB is the binding temperature. D is in units of nm2/time

