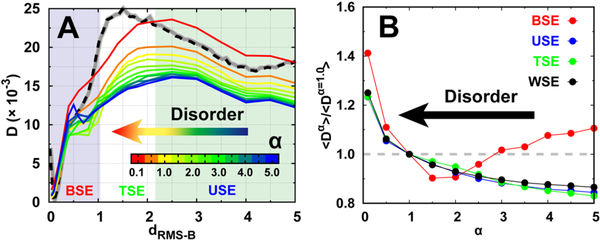
Fig. 3. Diffusion coefficient at different degrees of conformational disorder.
(A) The position-dependent D along dRMS−B. Free energy landscape with default disorder parameter α =1.0 at binding temperature is shown with dashed line as a guidance of the binding process, which can be further divided into three stages: the binding state ensemble (BSE), transition state ensemble (TSE), and unbinding state ensemble (USE), based on the transition path analysis shown in Fig. 1E. (B) The ratio between the mean D(dRMS−B) of different degrees and default (α =1.0) parameter of conformational disorder for different binding stages. “WSE” is an acronym for the “whole state ensemble”.

