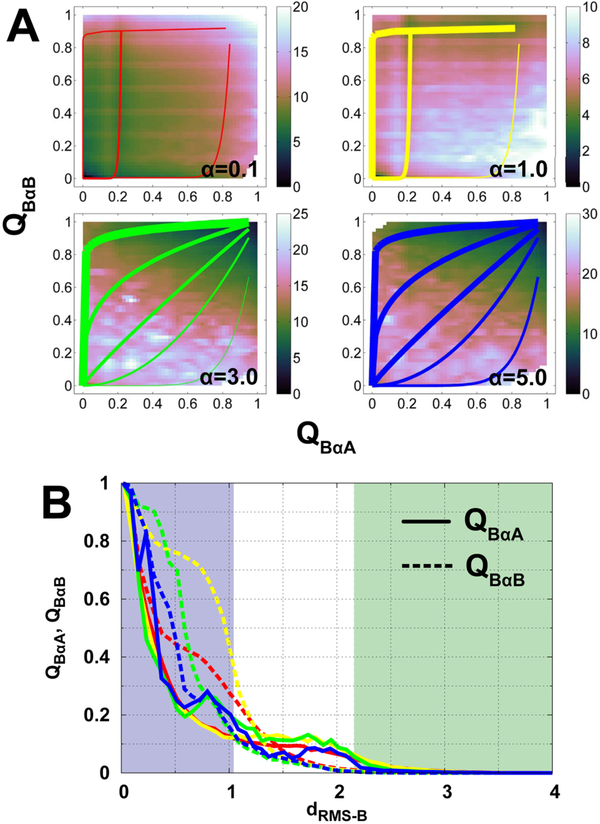
Fig. 4. Binding mechanisms at different degrees of conformational disorder.
(A) 2D binding free energy landscapes projecting onto QBαA and QBαB. QBαA and QBαB are the fractions of native binding contacts of helices αA and αB of pKID to KIX, respectively. The free energy landscapes of α=0.1, 1.0, 3.0, and 5.0 are plotted. The lines in each panel illustrate pathways, with thick ones indicating large flux and vice versa. (B) Evolutions of binding contacts of helices αA and αB of pKID along dRMS−B. Solid and dashed lines are QBαA and QBαB, Respectively, and different colored lines correspond to different degrees of conformational disorder. The color of shadows and lines follow the same scheme used in Fig. 3A.

