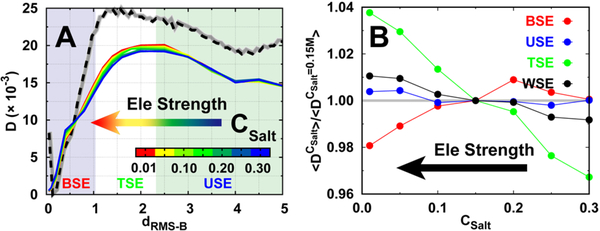
Fig. 5. Diffusion coefficient at different strengths of electrostatic interactions.
(A) The position-dependent D along dRMS−B. Free energy landscape with moderate salt concentration CSalt=0.15 M at binding temperature is shown with dashed line as a guidance of the binding process (B) The ratio between the mean D(dRMS−B) of different salt concentrations and moderate salt concentration (CSalt =0.15M) for different binding stages.

