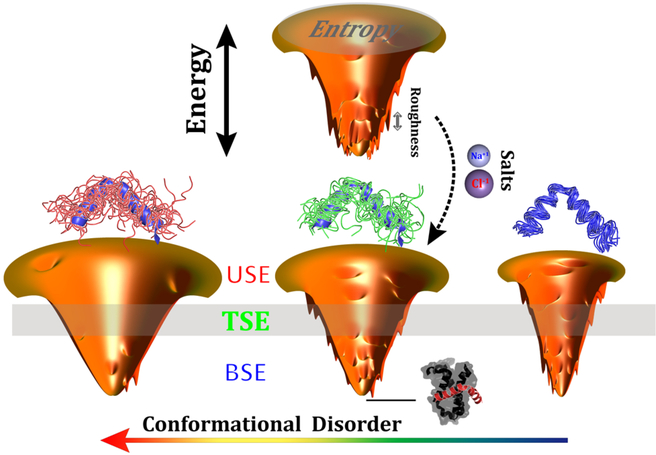
Fig. 7. Scheme illustrating the effects of conformational disorder and salt concentrations on the topography of binding energy landscapes.
The deepness, the size, and the roughness of the funnels represent the energy gap, entropy, and energy roughness of the energy landscapes, respectively. The single funnel at the top shows binding with moderate conformational disorder and low salt concentration (strong electrostatic interactions). The three funnels at the bottom show the change according to the conformational disorder. Conformational ensembles of pKID are shown on the top of each funnel, with the native structure colored blue. The bound complex of pKID-KIX is shown at the basin of the funnel, indicating the destination of binding.

