FIGURE 1.
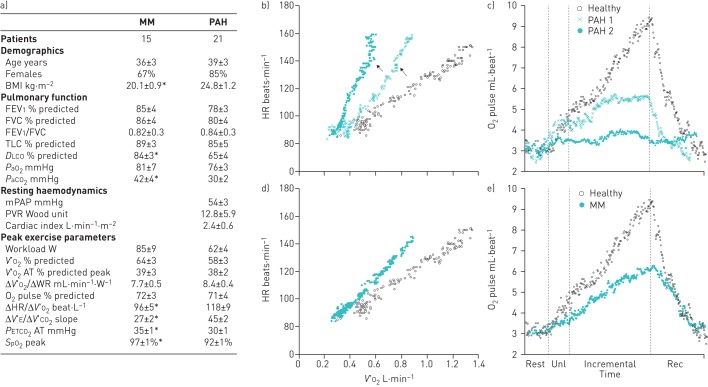
a) Demographics, pulmonary function, resting haemodynamics and cardiopulmonary exercise testing parameters for patients with mitochondrial myopathy (MM) and pulmonary arterial hypertension (PAH). Data are presented as mean±sem unless otherwise stated. Independent samples Student's t-test was used to compare parametric data between groups. b–e) Key cardiovascular responses during noninvasive cardiopulmonary exercise testing in two representative patients with PAH and a patient with MM. An age- and sex-matched healthy control was also added for comparison. This representation should be considered simply as a reference of expected values and kinetics for the variables of interest: how subjects would have performed had they not been ill. Note that while O2 pulse was downwardly displaced in the MM patient without a discernible change in curve appearance, PAH patients showed a flattened (PAH 1) or decreasing (PAH 2) trajectories at the late stages of exercise (c and e). Those abnormalities coincided with upward inflections of heart rate (HR) as a function of O2 uptake (V′O2) (arrows) in patients with PAH (b), which is not seen in the representative MM patient (d). BMI: body mass index; FEV1: forced expiratory volume in 1 s; FVC: forced vital capacity; TLC: total lung capacity; DLCO: diffusing capacity of the lung for carbon monoxide; PaO2: arterial oxygen tension; PaCO2: arterial carbon dioxide tension; mPAP: mean pulmonary arterial pressure; PVR: pulmonary vascular resistance; V′O2: oxygen uptake; AT: anaerobic threshold; WR: work rate; V′E: minute ventilation; V′CO2: carbon dioxide output; PETCO2: end-tidal carbon dioxide tension; SpO2: oxygen saturation measured by pulse oximetry; unl: unloaded exercise; rec: recovery. *: p<0.05.

