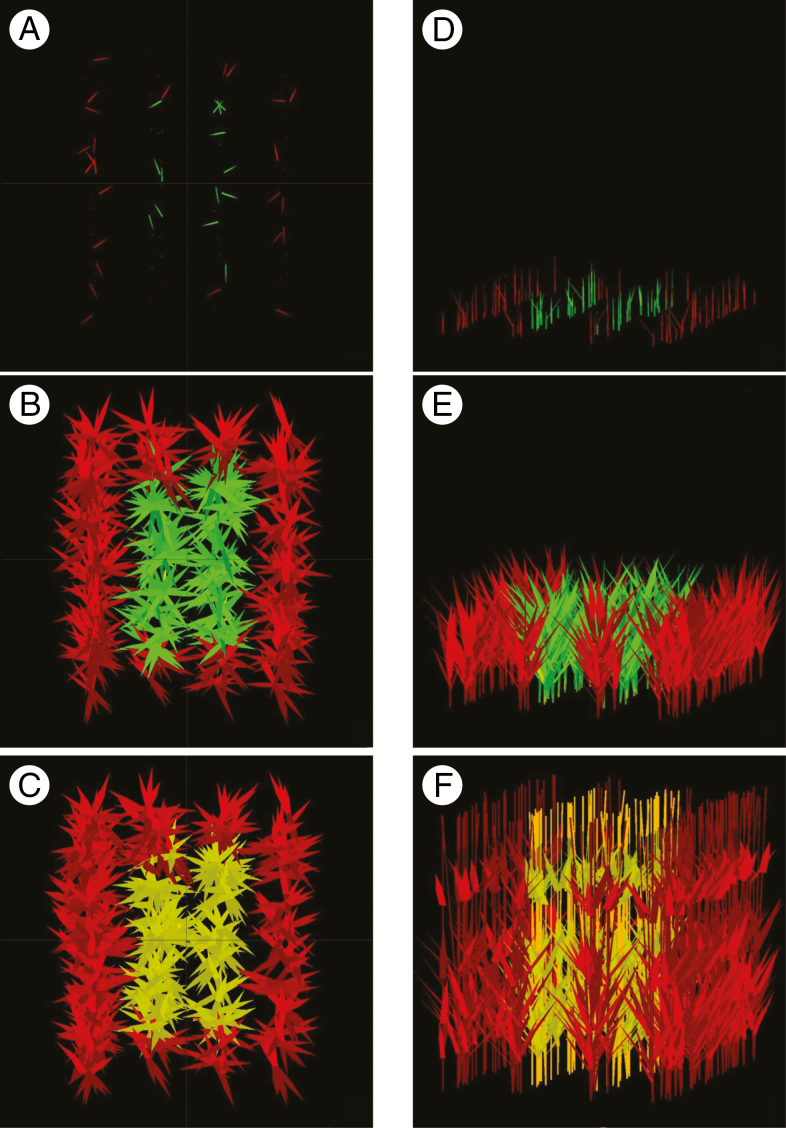
Fig. 1.
Vertical (A, B, C) and oblique views (D, E, F) of a simulated plot at three stages of growth: at emergence (A, D), during mounting (B, E), and at the end of the cycle (C, F). The plot consists of 99 plants at 217 plants m–2 according to expt 1; red denotes border plants, green represents emerged and non-senescent organs, and yellow represents dead organs.

