
Figure 1.
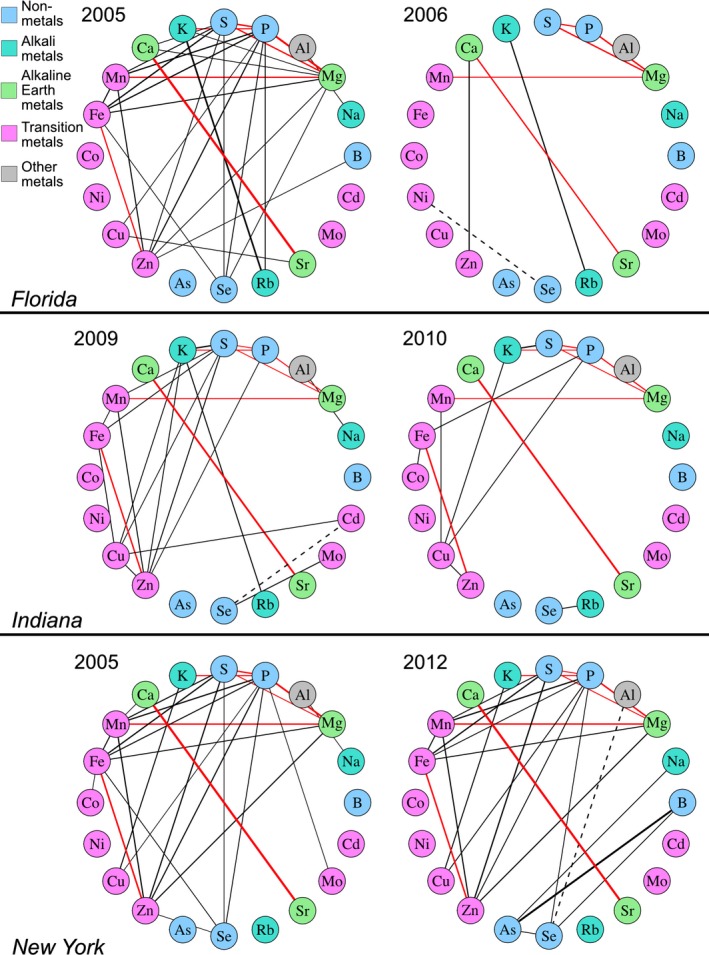
Element correlations diagrams for locations with repeated measurements. Pairwise correlations of 20 kernel elements in varying environments, shown for the experiments within locations having data from multiple years (FL, IN, and NY). Correlations were calculated as the Pearson correlation coefficient (r p) between concentration values for each element pair. Significance was evaluated using a Bonferroni correction for multiple tests within each environment and set at a corrected p value of 0.05. Lines between elements represent significant pairwise correlations, weighted by strength of correlation. Positive and negative correlations are represented as solid and dashed lines, respectively. Red lines indicate correlations present in at least 5 of the 6 environments shown