Figure 4.

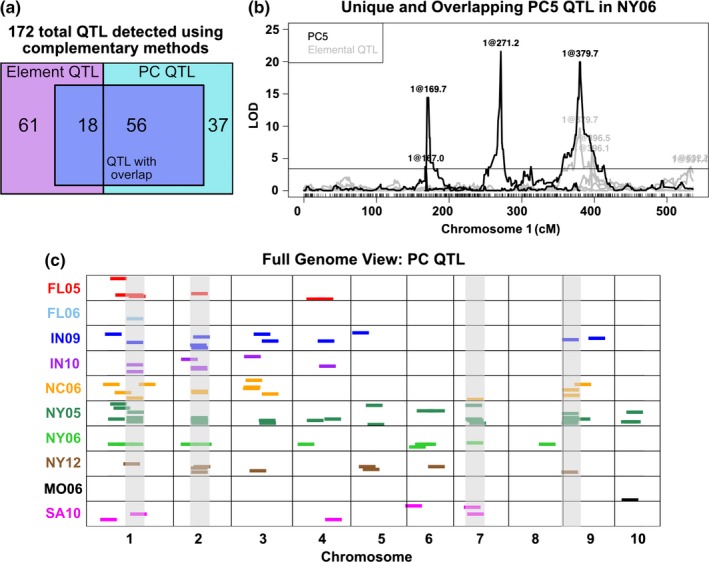
Principal component QTL from 10 environments. PCs were derived from elemental data separately in each of 10 environments and used as traits for QTL mapping. (a) One hundred and seventy‐two total element and PC QTL were mapped. The two boxes represent the 79 and 93 elemental and PC QTL, respectively. Eighteen element QTL overlap with PC QTL from the same environment. Fifty‐six PC QTL overlap with element QTL from the same environment. Sets of non‐unique QTL are shown in the center box. QTL unique to elements, 61, and to PCs, 37, are shown outside of the shared box. (b) QTL mapping output for PC5 from the NY06 population. Position on chromosome 1 is shown on the x‐axis, LOD score is on the y‐axis. All significant NY06 element QTL on chromosome 1 are shown in grey (α = 0.05). Two PC5 QTL, at 169.7 and 271.2 cM, are unique to PC5 and do not overlap with any elemental QTL. A PC5 QTL at 379.7 cM is shared with a molybdenum QTL. (c) Significant PC QTL (α = 0.05) for PCs in 10 environments. QTL location is shown across the 10 chromosomes on the x‐axis. Environment in which QTL was found is designated by color. QTL are represented as dashes of uniform size for visibility. Four regions highlighted in grey represent the four loci found for multiple PC traits in multiple environments (>2)
