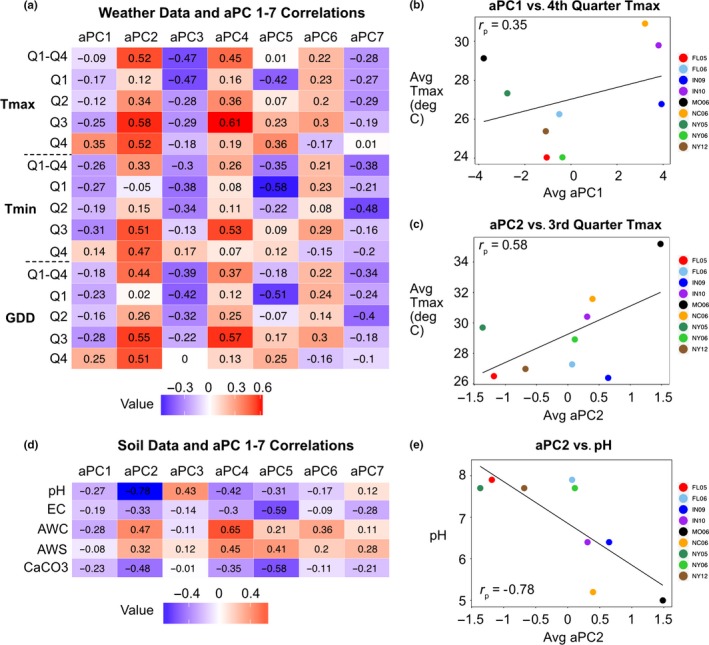
Figure 7.

aPC and Weather Variable Correlations. (a) Heatmap showing Pearson correlation coefficients (r p) between averaged aPC 1–7 values across environments and averages for maximum temperature, minimum temperature, and GDD across the growth season and for each quarter of the season. Red and blue intensities indicate strength of positive and negative correlations, respectively. (b) Average aPC1 values for nine environments versus average maximum temperature for each environment over the fourth quarter of the growing season. Points colored by environment. Pearson correlation coefficient is shown within the graph. (c) Average aPC2 values for nine environments versus average maximum temperature for each environment over the third quarter of the growing season. (d) Heatmap showing correlations between aPCs 1–7 and soil attributes: pH, electrical conductivity (EC), available water capacity (AWC), available water storage (AWS), and calcium carbonate (CaCO3). (e) Average aPC2 values versus pH
