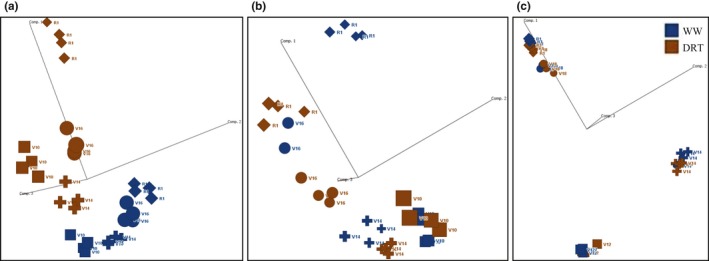
Figure 3.

Principal component analysis of differentially expressed (DE) genes. Principal components were calculated based on the expression levels of genes across tissues (component 1), developmental stages (component 2), and treatment (component 3). Leaf samples include 3,454 DE genes (a), ear samples include 6,946 DE genes (b), tassel tissue samples 19,850 DE genes (c). Blue color represents WW samples; brown color represents DRT samples. The following shapes represent plant stages at sampling: square ‐ V12, cross –V14, circle – V18, diamond –R1. There are four replicated samples for each stage
