
Figure 5.
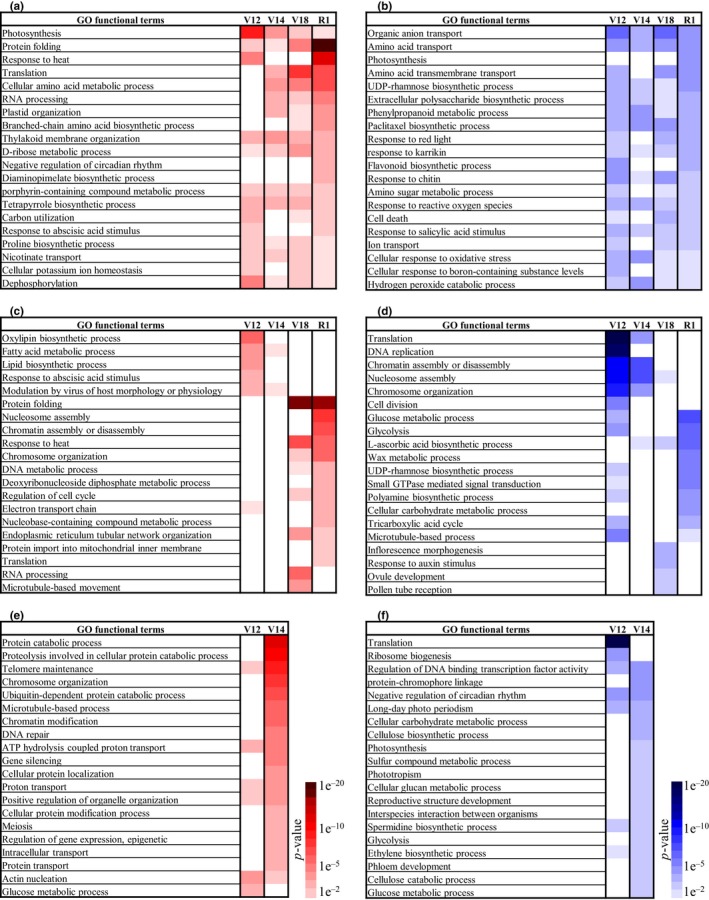
Gene Ontology (GO) enrichment of biological processes for DE genes under drought stress. Gene Ontology Fisher's exact test was used for the enrichment analysis of the DE genes (Table 4). A p‐value of 0.01 was used to select enriched GO terms. p‐value for drought stress up‐regulated terms shown in red, and down‐regulated terms shown in blue. The lowest p‐values are depicted by darker color. a and b leaves, c and d ears, e and f – tassels