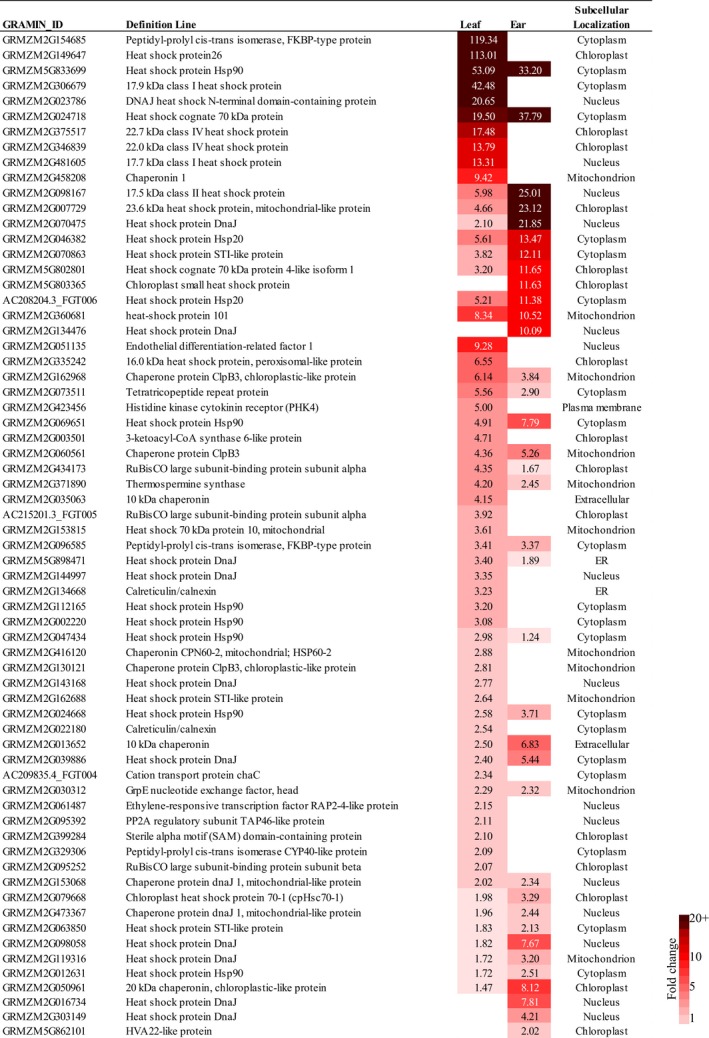
Figure 6.

Expression of genes in categories “protein folding” and “heat response” in leaves and ears at the R1 stage. The darkest color corresponds to the higher levels of induction under stress. Cutoff effective size was above twofold threshold at least in one tissue. A default of 10−6 FDR was used
