
Figure 2.
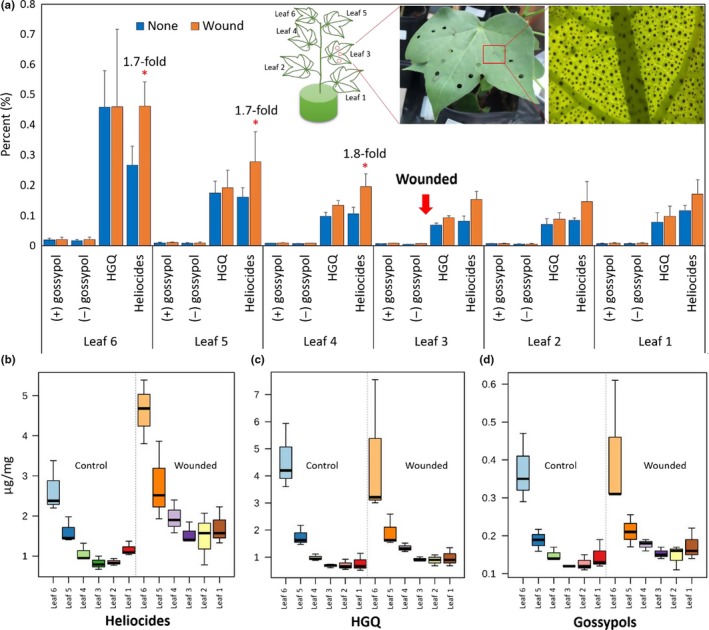
Terpenoid aldehyde (TAs) analysis of JACO GL foliar glands. (a) Different TA levels (% in total mg) in the leaf tissues (leaf 1–6) in response to the physical damage. The insets display a cotton plant in which leaves are numbered (left), a wounded plant at the fourth leaf of cotton using a 1/4ʺ round hole punch puncher hole (middle), and an enlarged image (right) displaying the leaf glands that produce TAs. B. Leaf‐by‐leaf analysis of heliocides (b), HGQ (c), and Gossypol (d) between control and treated cotton plants (One‐way ANOVA and Fisher's LSD as a post hoc analysis, n = 3, p < 0.005)