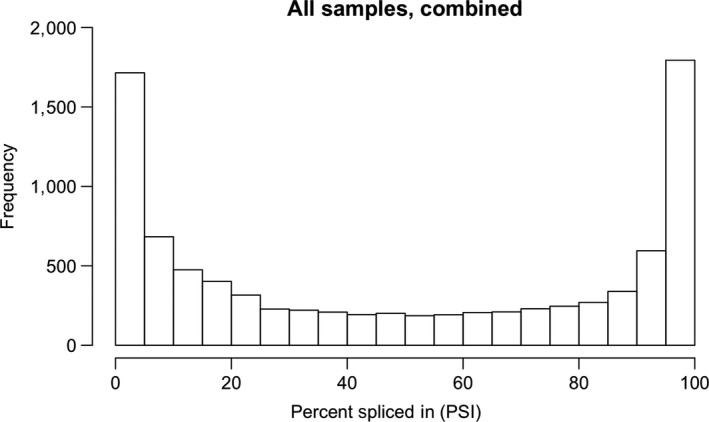
Figure 2.

Distribution of percent‐spliced‐in (PSI) for annotated splicing events in rice where each choice was supported by at least one RNA‐Seq alignment. The y axis is the frequency of splicing events, and the x axis the PSI between 0 and 100%. PSI was calculated as 100*L/(S + L), where L and S were the number of reads that supported the splicing choice that included (L) or excluded (S) the differentially spliced region. Read alignment counts from all 12 libraries were combined to obtain a global view of alternative splicing occurrence in rice seedlings. The U‐shaped character of the distribution persisted whether lower or higher thresholds of informative reads were used
