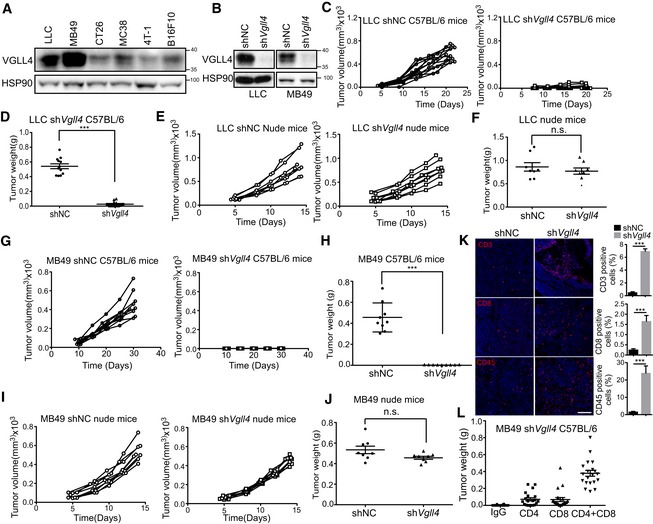
Figure 1. Loss of Vgll4 in tumor cells inhibits tumor growth in syngeneic mouse tumor models.

- VGLL4 protein expression levels in six murine tumor cell lines. Total cell lysates were analyzed by Western blot.
- VGLL4 protein levels were reduced in Vgll4‐depleted cells. Total cell lysates of Vgll4‐knockdown LLC and MB49 cells were analyzed by Western blot.
- Control or shVgll4 LLC cells were transplanted into C57BL/6 mice, and tumor‐growth kinetics was measured at the indicated times. n = 12 tumors for each group.
- Quantification of tumor weights 21 days after transplantation of control or shVgll4 LLC cells into C57BL/6 mice from (C). n = 12 tumors for each group. ***P < 0.001, two‐tailed Student's t‐test. The solid line represents the average weight ± SEM.
- Control or shVgll4 LLC cells were transplanted into nude mice, and tumor‐growth kinetics was measured at the indicated times. n = 8 tumors for each group.
- Quantification of tumor weights 15 days after transplantation of control or shVgll4 LLC cells into nude mice from (E). n = 8 tumors for each group. n.s. P > 0.05, two‐tailed Student's t‐test. The solid line represents the average weight ± SEM.
- Control or shVgll4 MB49 cells were transplanted into C57BL/6 mice, and tumor‐growth kinetics was measured at the indicated times. n = 9 tumors for each group.
- Quantification of tumor weights 30 days after transplantation of control or shVgll4 MB49 cells into C57BL/6 mice. n = 9 tumors for each group. ***P < 0.001, two‐tailed Student's t‐test. The solid line represents the average weight ± SEM.
- Control or shVgll4 MB49 cells were transplanted into nude mice, and tumor‐growth kinetics was measured at the indicated times. n = 8 tumors for each group.
- Quantification of tumor weights 15 days after transplantation of control or shVgll4 MB49 cells into nude mice from (I). n = 8 tumors for each group. n.s. P > 0.05; two‐tailed Student's t‐test. The solid line represents the average weight ± SEM.
- Immunofluorescent staining of CD3, CD8, and CD45 (red) counterstained with DAPI for DNA (blue) using control or shVgll4 LLC tumors from C57BL/6 mice. Statistical analysis of the percentage of CD3‐, CD8‐, and CD45‐positive cells in the tumors is shown in the right panel, respectively. n = 3 tumors for each group. ***P < 0.001, two‐tailed Student's t‐test, mean ± SEM. Scale bar 100 μm.
- Quantification of tumor weights 30 days after transplantation of shVgll4 MB49 cells into C57BL/6 mice receiving anti‐CD4 alone, anti‐CD8 alone, or both anti‐CD4 and anti‐CD8 blocking antibodies. n = 20 tumors for each group. The solid line represents the average weight ± SEM.
Source data are available online for this figure.
