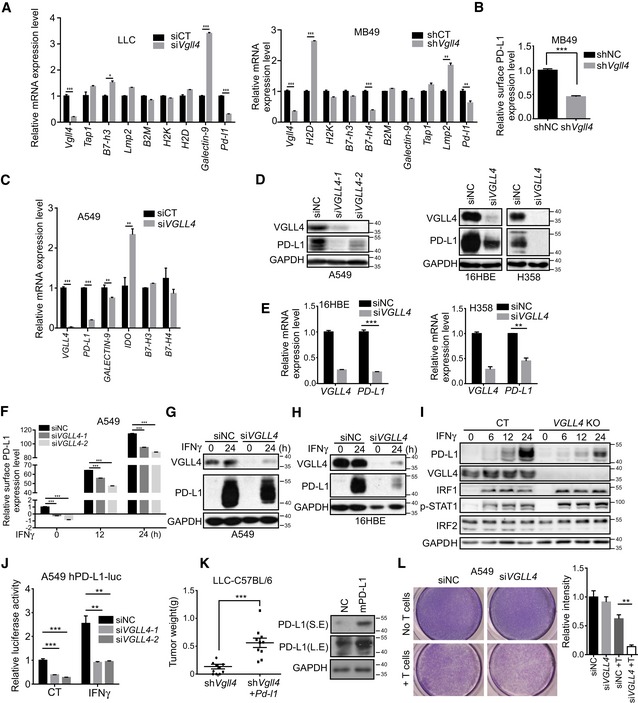
Figure 2. Disruption of VGLL4 expression suppresses PD‐L1 expression.

-
ARelative mRNA levels of immune‐related genes in Vgll4‐knockdown LLC or MB49 cells by qRT–PCR analysis. n = 3, mean ± SEM. *P < 0.05, **P < 0.01, ***P < 0.001, two‐tailed Student's t‐test.
-
BKnockdown of Vgll4 in MB49 cells decreased the surface expression of PD‐L1 protein on control or shVgll4 MB49 cells measured by flow cytometry analysis with anti‐mPD‐L1 antibody. n = 3, mean ± SEM. ***P < 0.001, two‐tailed Student's t‐test.
-
CRelative mRNA levels of immune‐related genes in Vgll4‐knockdown A549 cells by qRT–PCR analysis. n = 3, mean ± SEM. **P < 0.01, ***P < 0.001, two‐tailed Student's t‐test.
-
DImmunoblot analysis revealed the reduced expression of PD‐L1 protein in VGLL4‐knockdown A549, 16HBE, and H358 cells compared with control cells.
-
EqRT–PCR analysis revealed a reduction in PD‐L1 mRNA levels in VGLL4‐knockdown 16HBE and H358 cells by siRNA. n = 3, mean ± SEM. **P < 0.01, ***P < 0.001, two‐tailed Student's t‐test.
-
FFlow cytometry analysis of surface PD‐L1 levels in control and VGLL4‐knockdown A549 cells treated with IFNγ for the indicated times. n = 3, mean ± SEM. ***P < 0.001, one‐way ANOVA followed by Dunnett's test.
-
G, HImmunoblot analysis revealed the reduced IFNγ‐inducible PD‐L1 expression in VGLL4‐knockdown A549 (G) and 16HBE (H) cells.
-
IImmunoblot analysis of total cell lysates with the indicated antibodies revealed the attenuated IFNγ‐inducible PD‐L1 expression in VGLL4‐knockout (KO) A549 cells generated by CRISPR/Cas9.
-
JLoss of VGLL4 dampened the activity of PD‐L1 promoter reporter in a luciferase assay. A549 cells were transfected with human PD‐L1‐promoter luciferase plasmid and indicated siRNA, treated with IFNγ for 12 h, and subjected to a luciferase assay. n = 3, mean ± SEM. **P < 0.01, ***P < 0.001, one‐way ANOVA followed by Dunnett's test.
-
KOverexpression of mouse PD‐L1 in Vgll4‐knockdown LLC cells restored the tumor growth in C57BL/6 mice. Tumor weights of shVgll4 or shVgll4‐lenti‐mPD‐L1 LLC cells were determined 21 days after tumor cell transplantation into C57BL/6 mice (left panel). Expression of mPD‐L1 is shown in the right panel by immunoblot analysis with anti‐mPD‐L1 antibody. n = 10 tumors for each group. The solid line represents the average weight ± SEM. ***P < 0.001, two‐tailed Student's t‐test.
-
LKnockdown of VGLL4 in A549 cells enhances T cell‐mediated tumor cell killing. Activated T cells and A549 cells were co‐cultured in 24‐well plates for 4 days, and then, surviving tumor cells were visualized by crystal violet staining. Relative fold ratios of surviving cell intensities are shown in right panel. n = 3, mean ± SEM, **P < 0.01, two‐tailed Student's t‐test.
Source data are available online for this figure.
