Figure 3.

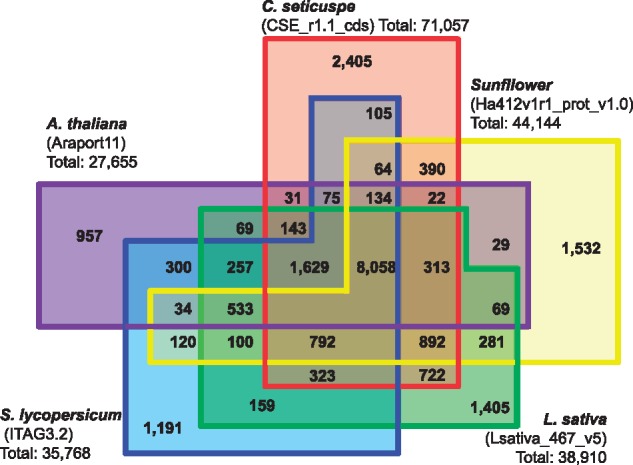
Venn diagram showing numbers of gene clusters in C. seticuspe, sunflower (H. annuus), lettuce (L. sativa), tomato (S. lycopersicum) and A. thaliana.

Venn diagram showing numbers of gene clusters in C. seticuspe, sunflower (H. annuus), lettuce (L. sativa), tomato (S. lycopersicum) and A. thaliana.