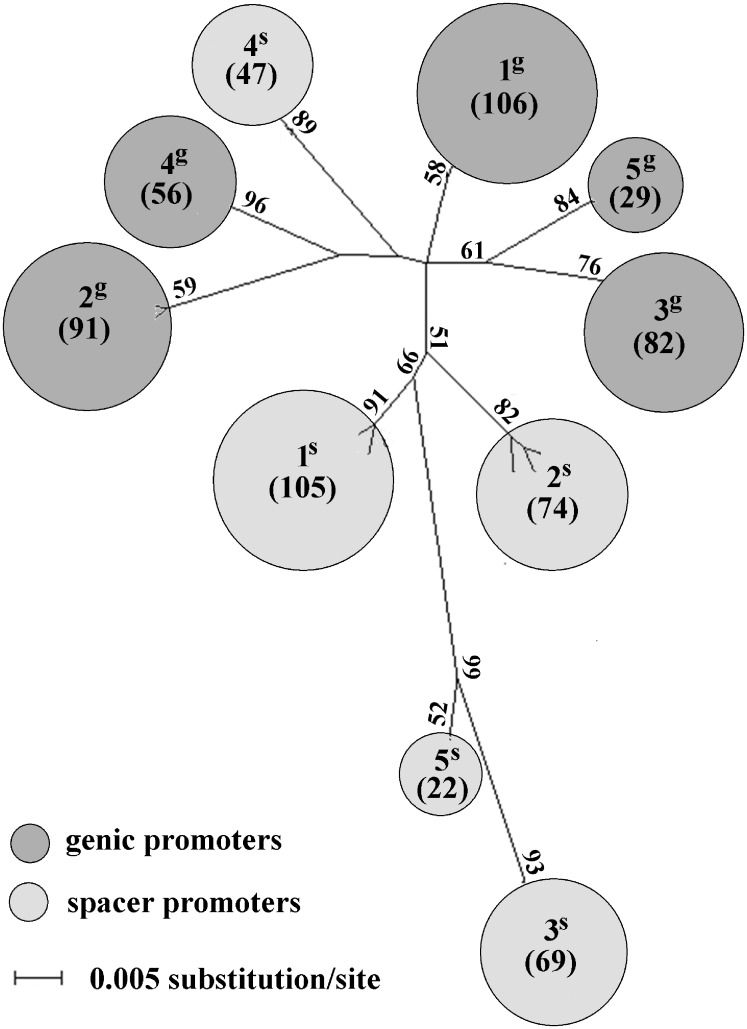
Figure 7.
ML phylogenetic tree constructed from the SNP distribution along putative promoters. Genic and spacer promoter variants, determined in Supplementary Fig. S6, are well separated. In addition, both genic and spacer promoter sequences are split into the same number (five) of clusters of 1g–5g and 1s–5s, respectively. Owing to high number of sequences, individual clusters are represented by circles with areas proportional to the number (specified in brackets) of corresponding promoters, specified in more details in Supplementary Table S10. Only bootstrap values higher than 50% are shown.

