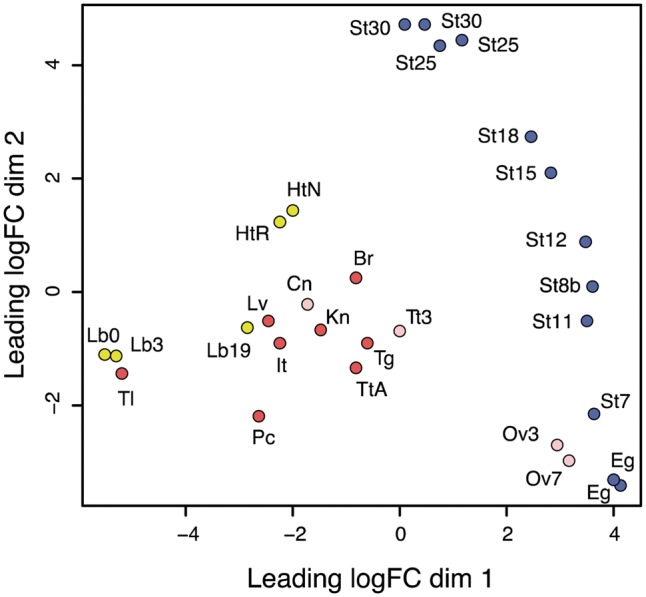
Figure 3.

MDS plot for RNA-Seq gene expression of P. waltl tissues, organs, and embryogenesis samples. Multi-dimensional scaling (MDS) plot showing relatedness between transcript expression profiles of organs, tissues, and embryos of P. waltl at different developmental stages. Red dots represent the expression profiles of adult tissues/organs and pink dots represent those of juveniles (3 or 7 months). The labels indicating the tissues and sources are defined in Table 1. Yellow dots represent the expression profiles in samples undergoing regeneration after amputation, where the labels Lb0, Lb3, and Lb19 indicate limb or limb blastema expression profiles at 0, 3, and 19 dpa, respectively; HtR and HtN indicate expression profiles of the hearts regenerating after amputation and in unamputated controls, respectively.
