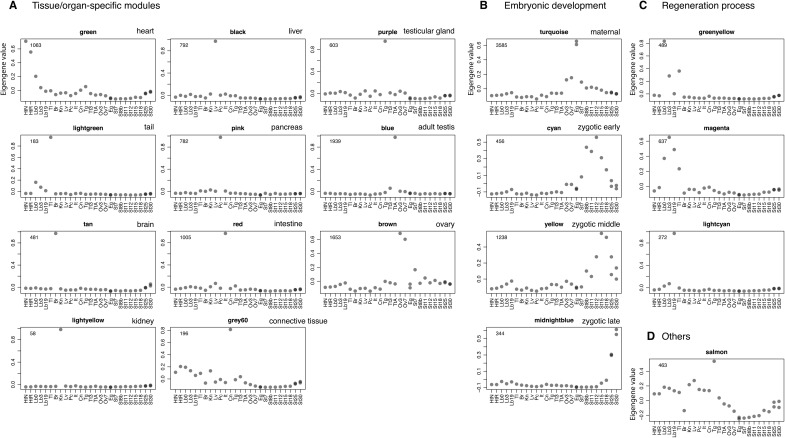
Figure 5.
Co-expression gene modules. The co-expression gene modules identified using WGCNA are shown. Each grey dot represents the value of the respective module’s Eigengene. The number at the top left in each panel indicates the number of genes belonging to that module that exhibit unique expression. The modules are classified into four categories based on the expression pattern: modules associated with (A) specific tissues/organs, (B) embryogenesis, (C) regeneration processes, and (D) others. The sample abbreviations indicated by labels at the bottom of each panel are defined in Fig. 3 legend.

