Figure 1.
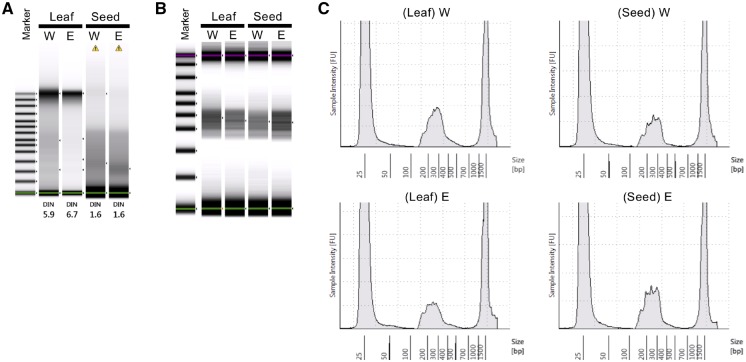
Evaluation of quality of DNA and AmpliSeq library prepared from the DNA using the Agilent 2200 TapeStation system. The AmpliSeq libraries were evaluated using the D1000 screen tape. (A) Quality of the DNA derived from the leaf and seeds. W and E indicate Williams 82 and Enrei, respectively. The numerical assessment of DNA quality ranged from 1 to 10 based on the DNA integrity number (DIN). A high DIN indicates highly intact DNA, whereas a low DIN indicates degraded DNA. (B) Distribution of amplicons in the AmpliSeq library shown as a gel image. (C) Electropherogram of the same AmpliSeq library as shown in (B). Lower (25 bp) and upper (1,500 bp) peak are the standard markers. The middle peak indicates the library.

