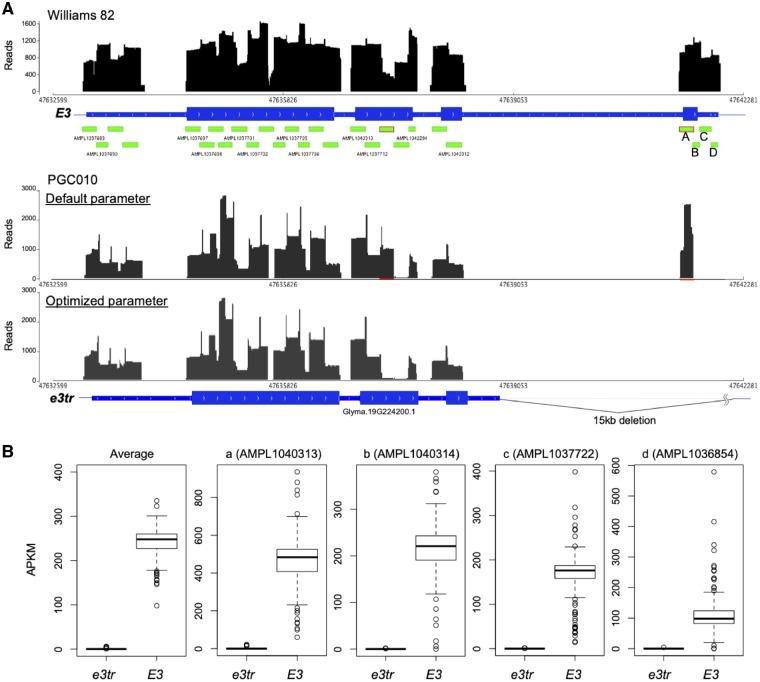
Figure 3.
Distribution of mapped sequence reads of two different alleles in the E3 gene region. (A) Top: Read coverage of Williams 82 with the default parameters of TMAP. Bottom: Read coverage of PGC010 with the default and optimized parameters of TMAP. The E3 gene of PGC010 has a large deletion in the fourth exon. (B) APKM of amplicons from variant (e3T) and wild type (WT) on the fourth exon of E3. Average APKM of four amplicons (left most) and APKM of each amplicon—(a) AMPL1040313, (b) AMPL1040314, (c) AMPL1037722, and (d) AMPL1036854.

