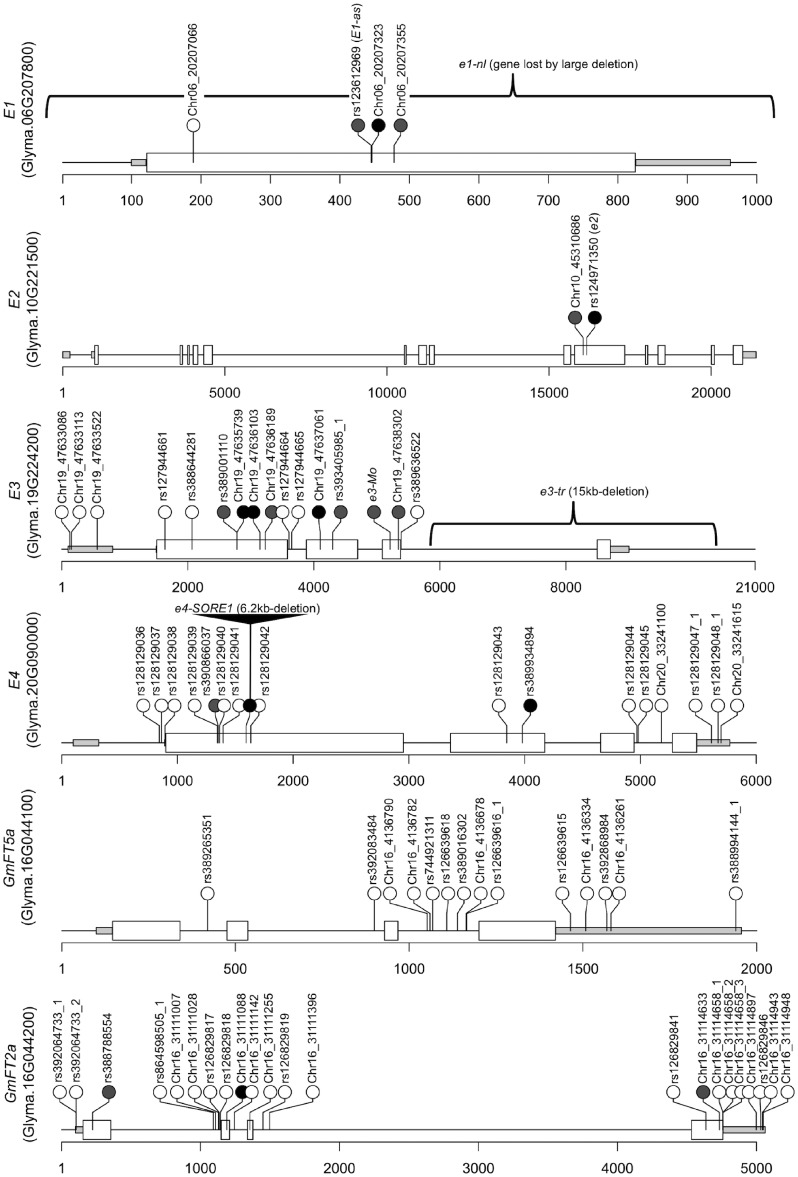
Figure 4.
Detected variants in E1, E3, E4, FT5a, and FT2a from 192 mini-core collection. The grey and white boxes indicate UTRs and exons. The solid lines indicate 5′-uptream and intron regions. The black and grey circles indicate loss-of-function (described as ‘HIGH’ impact on the gene function in Supplementary Table S8) and missense variants. Braces indicate known large InDels. These InDels can be detected by read depth.

