FIGURE 4:
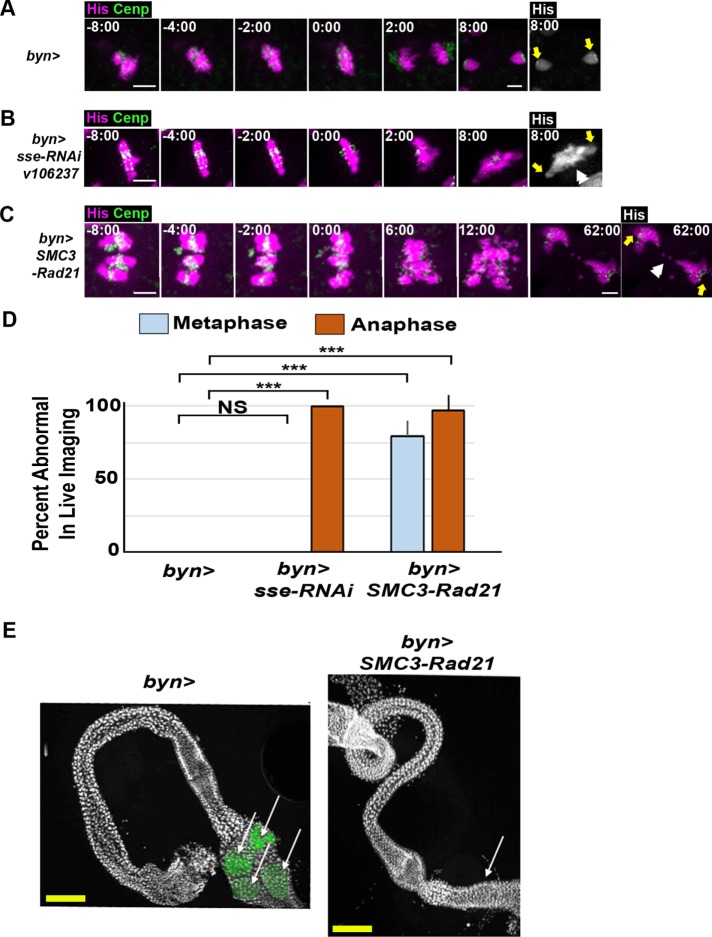
Cohesin exit gate opening is required for mitotic fidelity and organ development in papillar cells. (A–C) Time lapse of papillar cell mitosis from the indicated genotypes. His-2av-GFP, magenta; CenpC-tomato, green; time, minutes from anaphase onset. Final panel depicts histone channel only; yellow arrows show spindle pole position. White double arrowhead indicates DNA bridge. Scale bar = 5 µm (main images), 1 µm (insets). (D) Quantification of the percentage of cells with aberrant metaphase and anaphases of the indicated genotypes (+SEM, from left to right, N = 12, 8, 27 metaphase and N = 12, 11, 39 cells per genotype). (E) Representative images of the adult hindgut of animals of the indicated genotypes (from N = 12 control and 8 SMC3-Rad21 animals). DAPI (DNA, white); papillae pseudocolored (green). Arrows indicate the location (or absence) of papillar structures. Yellow scale bar = 12.5 µm.

