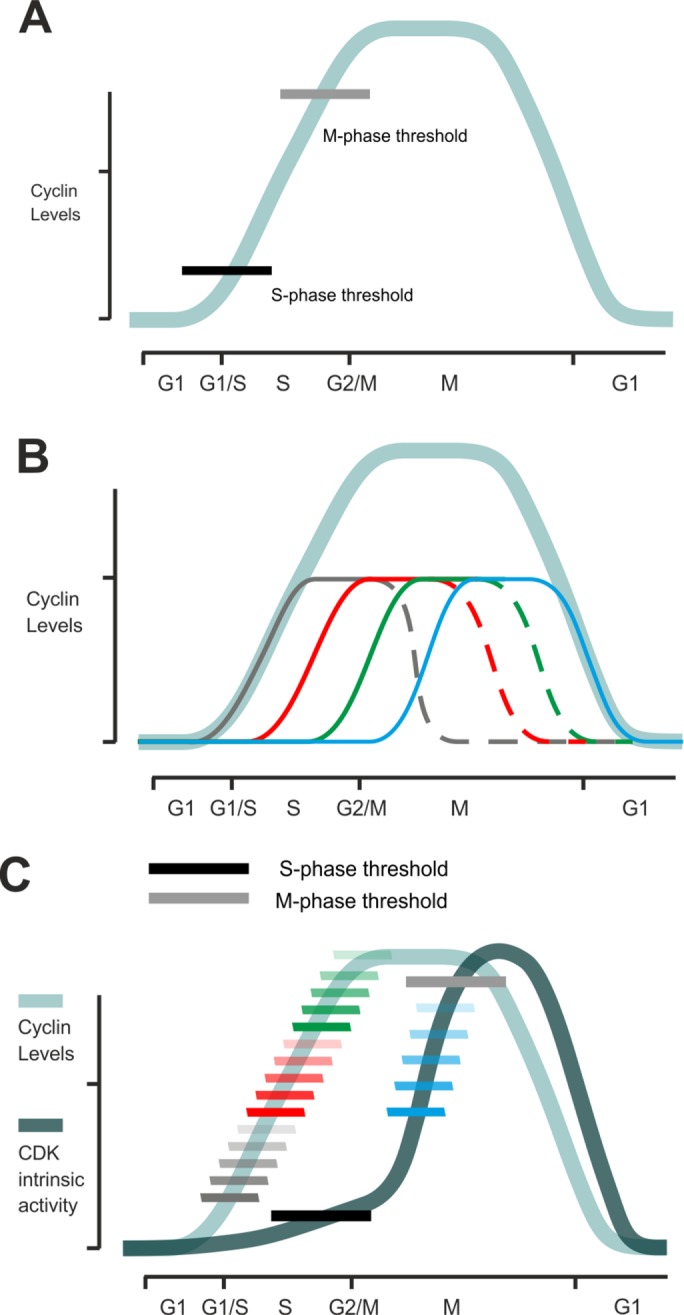
FIGURE 1:

(A) The principle of the quantitative model of CDK function in the cell cycle (Stern and Nurse, 1996). Accumulating CDK activity triggers cell cycle stages at different activity thresholds. (B) The net profile of activated CDK complex (light blue line) is a sum of CDK complexes activated by cell cycle–specific cyclins. For example, in budding yeast, there are four major types of cyclins that drive the cell cycle, designated here by different colors. It is not yet clear how the quantitative model and the functional specificities of periodically expressed cyclins can be combined into a unified model. (C) When the increase in specificity of sequential CDK complexes is taken into account, the general activity profile of CDK (dark blue line) has a delayed response compared with the accumulation of cyclin–CDK complexes (light blue line). Patterns of linear docking motifs and cyclin-specific time windows can create a wide dynamic range of CDK thresholds in the cell cycle.
