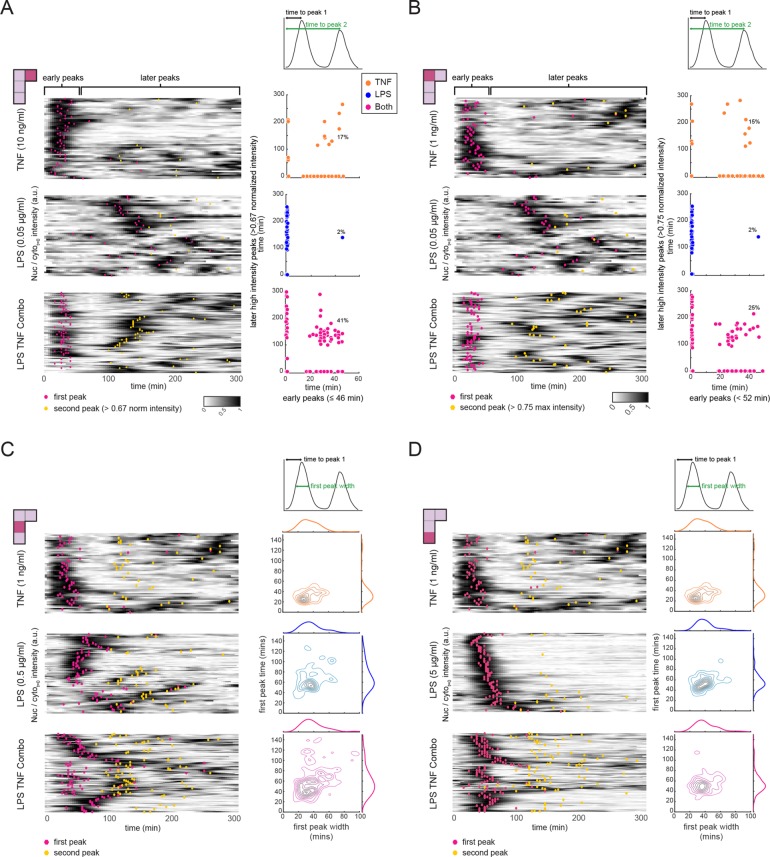
FIGURE 3:
The interaction effect for NF-κB activation dynamics occurs at the single-cell level. NF-κB activation dynamics at the single-cell level for the following concentration combinations (panel A: 0.05 μg/ml LPS, 10 ng/ml TNF; panel B: 0.05 μg/ml LPS, 1 ng/ml TNF; panel C: 0.5 μg/ml LPS, 1 ng/ml TNF; panel D: 5 μg/ml LPS, 1 ng/ml TNF). Cells were treated with TNF alone, LPS alone, or a combination of both ligands. Heatmaps for all three conditions, where each row represents a single-cell trace of NF-κB nuclear translocation over time. Peaks corresponding to NF-κB nuclear localization are dark (see color scale), with local maxima indicated by pink (first peak) or yellow (second peak) dots. For A and B scatter plots relate the time of any early peak (peaks occurring in 46 min or less) to the timing of a strong second peak occurring after 46 min. Under the stimulation conditions used in C and D, the first and second peak converge to form a longer peak in the combined stimulus case. To capture this phenomenon, we plot contour plots of the first peak width vs. first peak time beside each heatmap along with kernel density estimates of each of the features in the marginal axes. For each panel, the single-cell features that are compared can be found in the schematic above the scatter plots.

