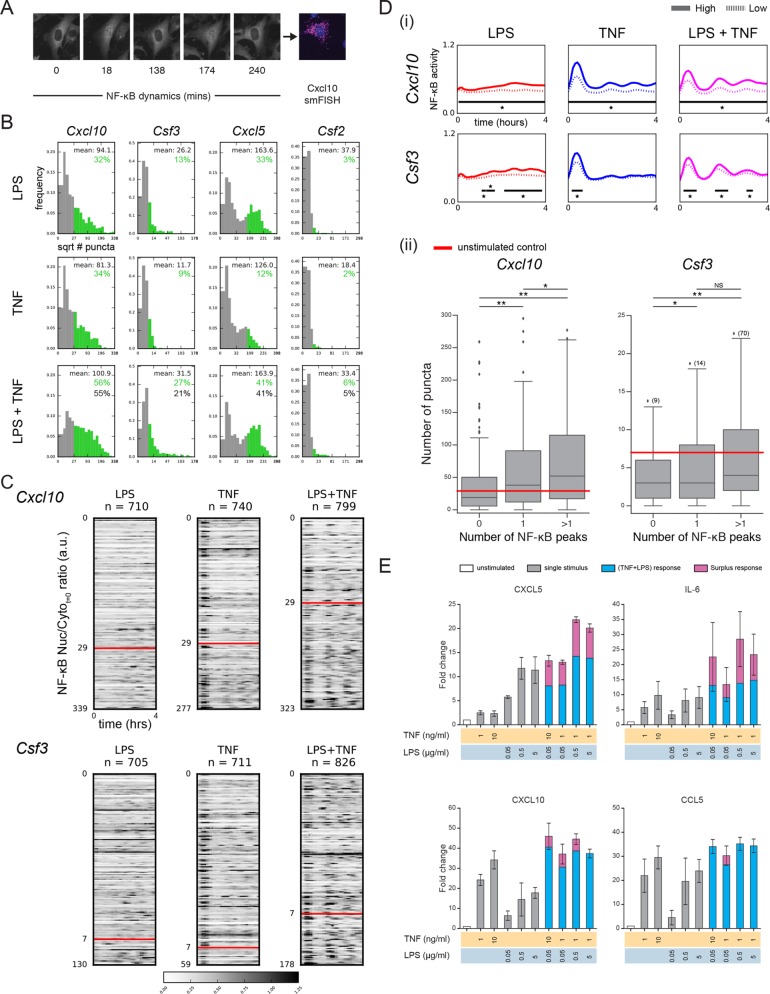
FIGURE 4:
Combined TNF and LPS stimulation translates into differences in gene expression and cytokine secretion. (A) Microscopy images illustrating the combination of live-cell imaging of NF-κB dynamics and smFISH. Images shown are for cells stimulated with both TNF (1 ng/ml) and LPS (5 µg/ml) and smFISH used probes against Cxcl10. (B) Dual stimulation is associated with changes in gene expression for several NF-κB target genes. For each target gene, cells were stimulated with TNF (1 ng/ml), LPS (5 µg/ml), or both. For each condition histograms of the square root of mRNA puncta per cell, as determined by smFISH, are shown. A threshold of expression was set based on the 95th percentile of the unstimulated control and bars are colored green where the signal is above this threshold. Mean of the subpopulation of cells with high transcript expression (green) is shown along with the observed (green) and expected (black) percentage of cells in the population above the threshold. The expected response was calculated using FLPS+FTNF-FLPS*FTNF, where FLPS is the fractional response to LPS and FTNF is the fractional response to TNF. (C) Increased mRNA expression is linked to increased NF-κB dynamics. For Cxcl10 and Csf3, cells in each stimulus condition were rank ordered according to the number of mRNA puncta and heatmaps of NF-κB dynamics for all cells are shown. Peaks corresponding to NF-κB nuclear localization are black (see color scale) and were scaled between 0 and 1.25. For each gene, the threshold used in B is indicated by the red line and was used to separate cells into those with low and high gene expression based on a control measurement. (D) (i) The average NF-κB dynamics of cells with low and high gene expression is distinct. For each condition cells were separated according to the mRNA puncta threshold defined in B and the mean NF-κB trace for each subgroup is shown. High expressing cells are indicated by the unbroken line and low expressing cells by the dotted line. Black bars and * indicate the timepoints at which differences between the two subgroups were significant using the Kolmogorov–Smirnov test with a confidence level of p = 0.01. Note that for Csf3 in the LPS condition two of the bars are close to each other but are in fact separated by a single time point. (ii) For each cell in the dual stimulus condition the number of NF-κB peaks during the time course was determined. Cells were binned into three groups based on the number of peaks and the number of puncta for cells in each bin is shown. Data shown are for Cxcl10 and Csf3. Significance was calculated using a two-sided independent t test (* p < 0.05, ** p < 0.001). Owing to the broad range of Csf3 expression, outliers are not shown but instead indicated by the number in parenthesis next to the diamond. (E) Cytokine secretion by cells treated with a range of stimulus combinations. Fold change of cytokine secretion normalized to the untreated control (white) for an immunoassay performed 6 h after stimulation. For the combined stimulus conditions any signal above an additive effect of the individual ligands is indicated in pink. Increased secretion of cytokines is observed upon dual stimulation compared with either stimulus alone, most notably for CXCL5 and IL6. Secretion is reported in MFI. N = 3 independent experiments.

