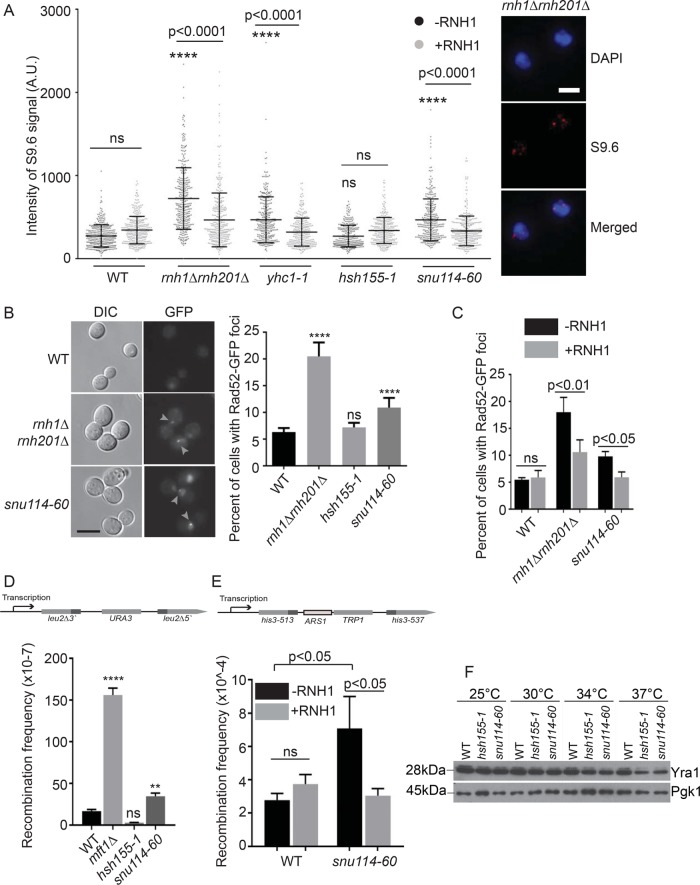
FIGURE 2:
R-loop-associated genome instability in snu114-60. (A) s9.6 antibody staining intensities in chromosome spreads. ****p < 0.0001 relative to WT -RNH1. Right, representative images; scale bar = 2 μm. (B) Frequency of Rad52-GFP foci (highlighted with gray arrows), scale bar = 5 μm. (C) Suppression of Rad52-GFP foci by ectopic RNH1 expression. (D, E) Frequency of direct repeat recombination on the indicated plasmid (D) or integrated genomic reporter (E). Reporter construct schematics are presented above each panel. (F) Representative Western blot of Yra1 protein level in the indicated strains and temperatures. (A, C, E) one-way ANOVA, (B) Fisher’s exact test, and (D) Student’s t test. **p < 0.01; ****p < 0.0001.

