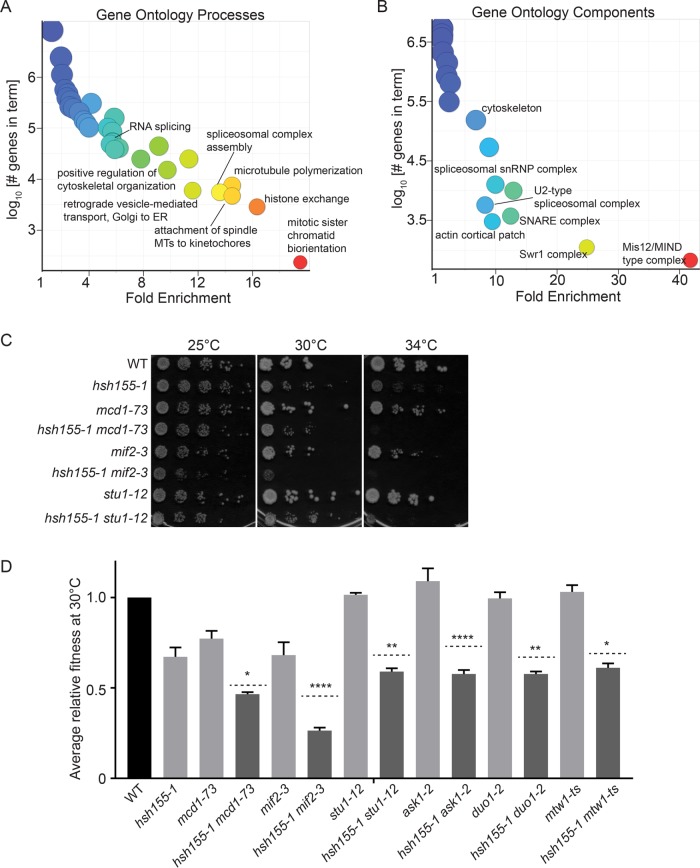
FIGURE 3:
Genetic interaction network of hsh155-1. (A) GO biological process and (B) cellular component enrichments for hsh155-1 negative interactions (Supplemental Tables S1 and S2). Warmer colors associate with higher enrichment. (C, D) Validation of negative genetic interactions by (C) spot dilution assays and (D) growth curves. For D, light gray bars: fitness of single mutants; dashed lines: calculated expected fitness of double mutants using multiplicative model; dark gray bars: observed fitness of double mutants. Two-way ANOVA was used to calculate statistical significance between observed and expected fitness of double mutants. *p < 0.05; **p < 0.01; ****p < 0.0001.

