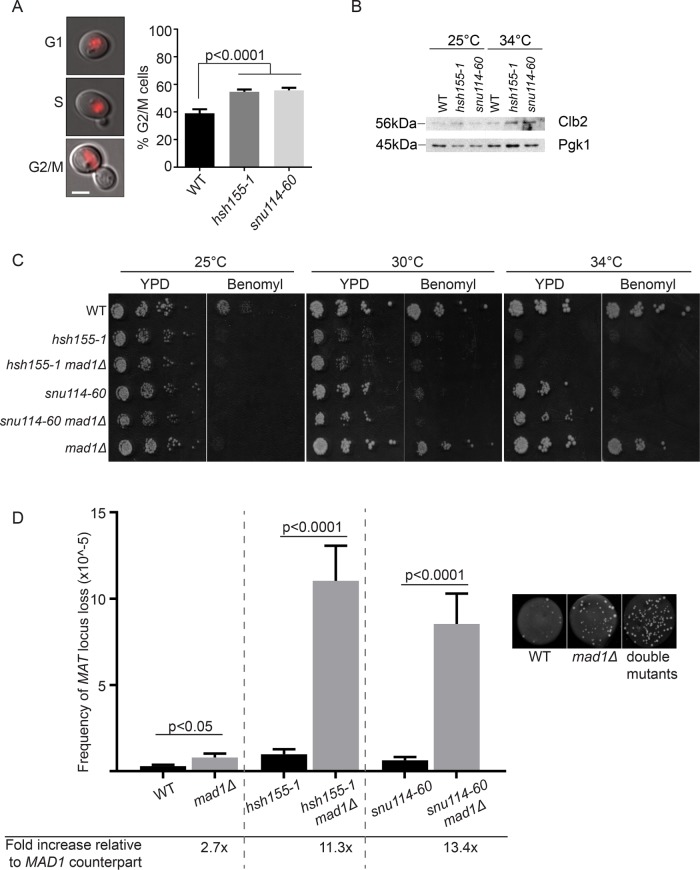
FIGURE 4:
Mitotic defects in spliceosome mutants. (A) Proportion of G2/M cells determined by budding relative to nuclear state determined by Hta2-mCherry fluorescence (left panels, scale bar = 2 μm); Fisher’s exact test. (B) Western blot of Clb2 protein levels in the indicated strains and temperatures. (C) Spot dilution assay of benomyl sensitivity (15 μg/ml benomyl). (D) Frequency of MAT loss in single (black bars) and mad1Δ double mutants (gray bars), grown at 25°C. Right, representative images of WT, mad1Δ and double mutant spots. Student’s t test was used to calculate significance. (A, D) Mean values and SEM are shown, n = 3.

