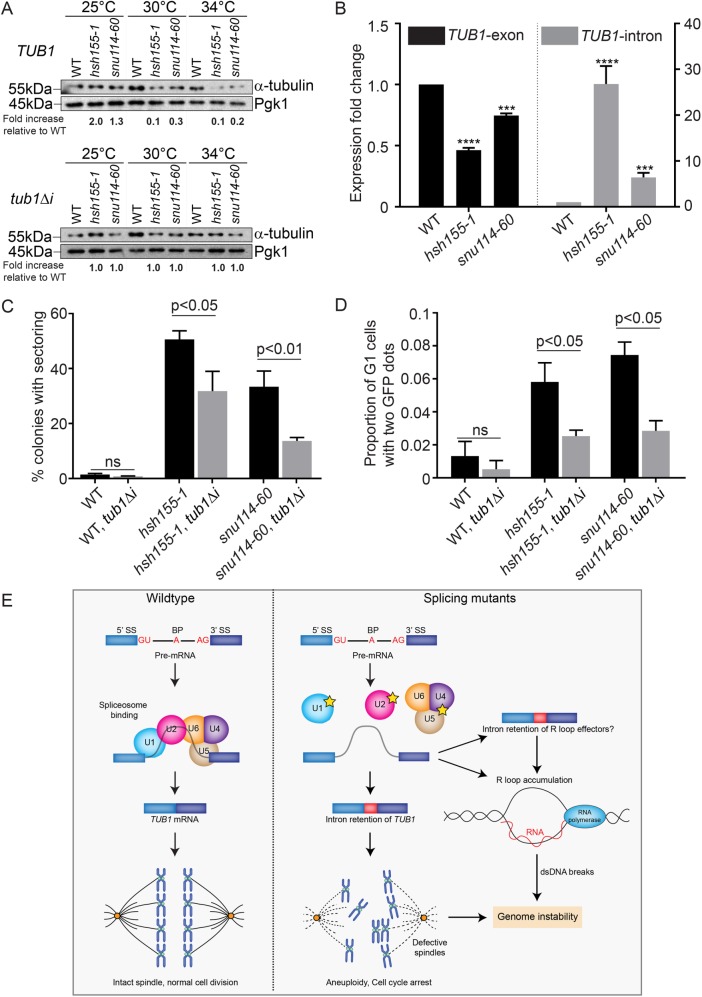
FIGURE 5:
Tubulin stability contributes to genome maintenance in splicing mutants. (A) Western blot of relative α-tubulin protein levels. Top, TUB1; bottom, intronless TUB1. (B) Quantification of TUB1 mRNA transcript levels from exon region (left) and TUB1 intron region (right) by RT-qPCR. Asterisks show p values of ΔΔCt: ***p = 0.0002; ****p < 0.0001. (C) CTF phenotypes in TUB1 or tub1Δi strains. (D) Endogenous Chr III stability in hsh155-1 and snu114-60 with intronless TUB1 (gray bars). (C, D) Fisher’s exact test. (E) Model of defective splicing-induced genome instability in yeast. (B, C, D) Mean values with SEM are shown, n = 3.

