FIGURE 2:
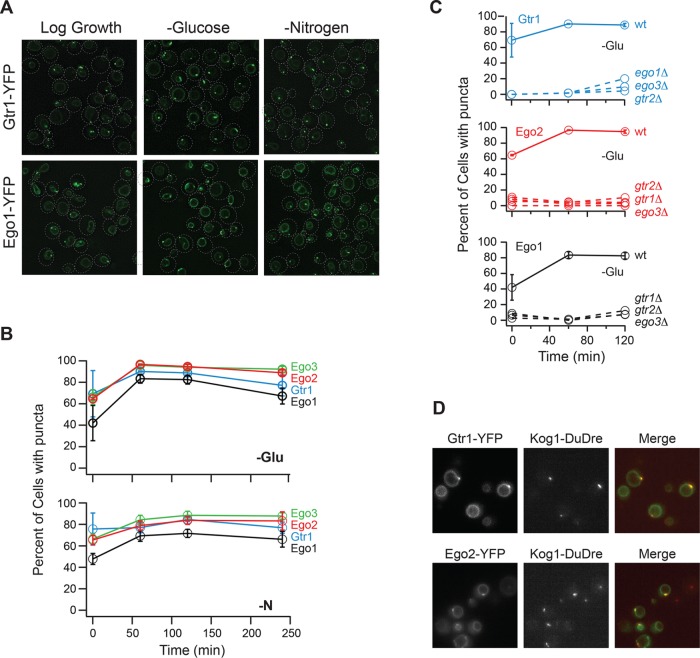
EGOC forms puncta in log growth and starvation conditions. (A) Gtr1-YFP and Ego1-YFP localization before (log growth), and 60 min after, glucose and nitrogen starvation. The dashed lines show the position of each cell in the bright-field image. (B) Time-course data showing the fraction of cells containing Ego1-YFP, Ego2-YFP, Ego3-YFP, and Gtr1-YFP puncta during glucose and nitrogen starvation (top and bottom panels, respectively). (C) Time-course data showing the fraction of cells containing Gtr1-YFP, Ego1-YFP, and Ego2-YFP puncta in strains missing Gtr1, Gtr2, Ego1, or Ego3 (as labeled). For B and C, each time point shows the average and SD from experiments carried out on two different days, with 100–300 cells per time point per replicate. (D) Localization of Gtr1-YFP and Kog1-DuDre (top panel) and Ego2-YFP and Kog1-DuDre (bottom panel) after 60 min of glucose starvation.

