FIGURE 3:
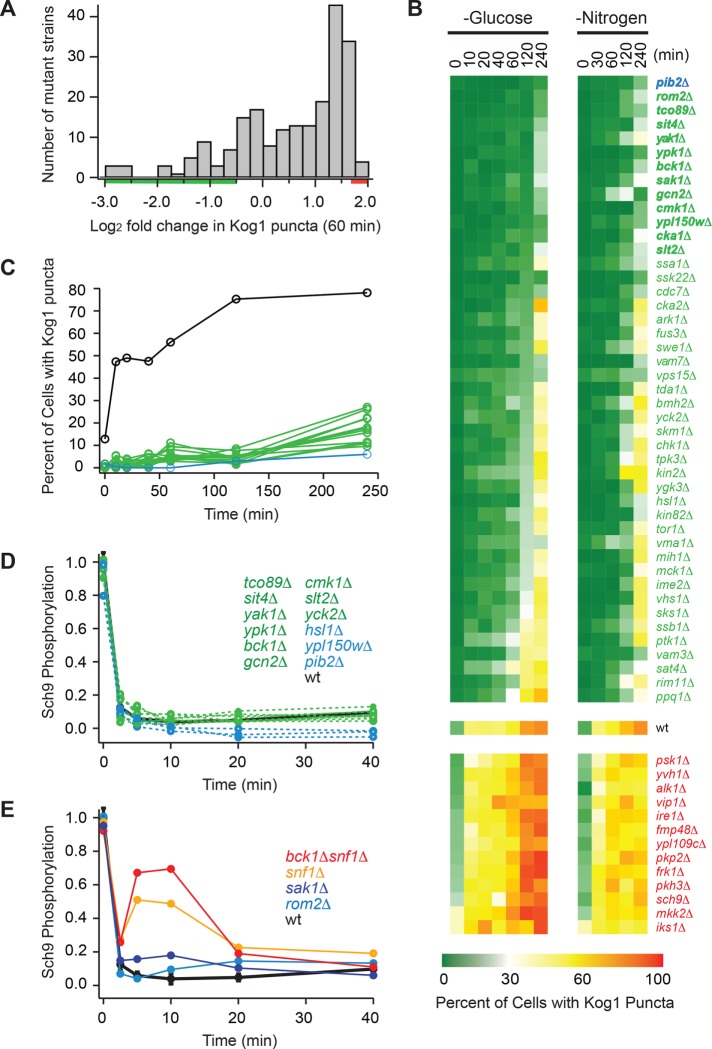
Screen for regulators of TORC1-body formation. (A) Histogram summarizing the influence that deleting 209 different genes (including all 139 nonessential kinases and phosphatases in yeast) has on Kog1-YFP foci formation. The score for each strain is based on the percentage of cells that form foci after 60 min of glucose starvation (based on data from at least 100 cells) and is normalized using wild-type data to calculate fold change. The raw data for each strain are included in Supplemental Table S1. (B) Heat map showing time-course data for the 45 strains that formed the fewest bodies in the initial screen (green/blue gene names), the 13 strains that formed the most bodies in the initial screen (red gene names), and the wild-type strain (wt), in glucose and nitrogen starvation conditions. Each colored square shows the fraction of cells with Kog1-puncta at a particular time point, based on images of at least 100 cells. (C) Time-course data for the 13 strains with the largest defects in body formation (green and blue lines; gene names shown in bold in B), and the wild-type strain (black line). (D, E) Quantification of band-shift data measuring Sch9 phosphorylation during glucose starvation in strains missing key regulators of TORC1-body formation. The data were normalized so that the level of Sch9 phosphorylation in the wild-type strain at time zero is set at 1.0. The raw bandshift data for each strain are shown in Supplemental Figure S3.

