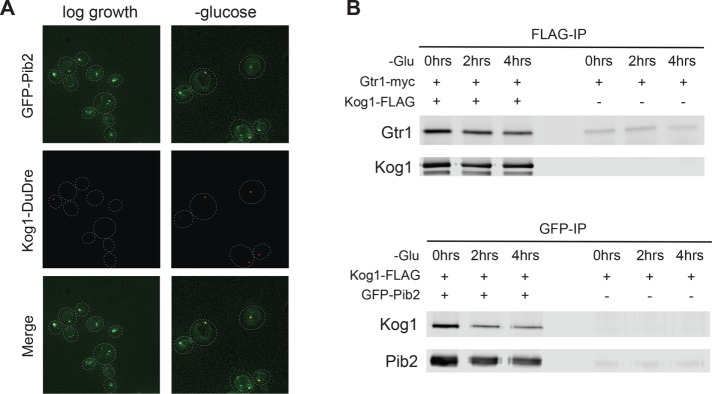
FIGURE 6:
Pib2, EGOC, and TORC1 interact in log growth and starvation conditions. (A) Localization of GFP-Pib2 and Kog1-DuDre during log growth (left panels) and after 60 min of glucose starvation (right panels). The dashed lines show the position of each cell in the bright-field image. (B) Coimmunoprecipitation experiments following interactions between Gtr1 and Kog1 (top panel) and Pib2 and Kog1 (bottom panel) before (0 min) and after 2 and 4 h of glucose starvation. The right-hand side of each blot shows the data for a mock IP (IP from cells missing the epitope tag on Kog1 or Pib2) used to measure the background levels of Gtr1 and Kog1 in the precipitate.

