FIGURE 1:
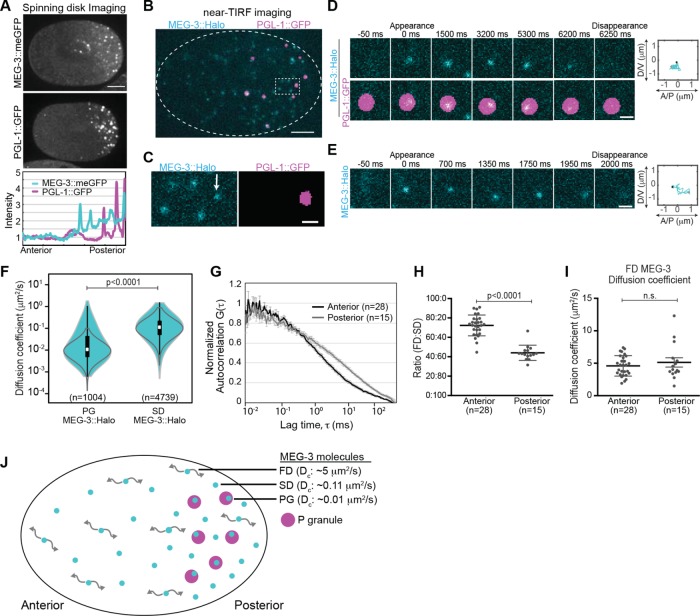
Single-molecule imaging of MEG-3::Halo. (A) Top, spinning disk confocal images of MEG-3::meGFP and PGL-1::GFP embryos at NEBD. Scale bar = 10 μm. Anterior is to the left, and posterior is to the right in this and all subsequent images. Bottom, intensity profile along the anterior/posterior axis of the embryos shown above (normalized to the anterior pole). (B) Near-TIRF imaging of MEG-3::Halo; PGL-1::GFP embryos. MEG-3::Halo molecules (cyan) are present both within PGL-1::GFP granules (magenta) and in the surrounding cytoplasm. PGL-1::GFP granules are segmented. Scale bar = 5 μm. (C) Enlargement of the region in B indicated by the dotted box. Note the presence of MEG-3::Halo molecules both within (PG molecule, marked by arrow) and outside (SD molecules) of the segmented PGL-1::GFP granules. Under these imaging conditions, fast-diffusing MEG-3::Halo molecules are blurred and cannot be tracked. Scale bar = 1 μm. (D, E) Examples of the appearance and disappearance of single MEG-3::Halo PG (D) and SD (E) molecules. Time relative to the initial appearance of the molecule is indicated above the panels. Right, the trajectories of the corresponding molecules with the black and the gray dot showing the appearance and disappearance events, respectively. Scale bar = 1 μm. (F) Violin plot (log-scale) of estimated Dc of PG and SD MEG-3::Halo molecules in the posterior. White dots = median, box = 25th and 75th percentiles, whiskers = 1.5X the interquartile range from the 25th and 75th percentiles. Statistical significance in F, H, and I were determined with Student’s t tests (two-tailed). Gray lines indicate Dc estimates from simulated Brownian motion of molecules with Dc = 0.01 μm2/s (left) and Dc = 0.11 μm2/s (right). (G) FCS autocorrelation curves of MEG-3::meGFP in the anterior and posterior cytoplasm (anterior, n = 28; posterior, n = 15). Error bars indicate SEM. (H) Ratio of fast and slow-diffusing components estimated by fitting the FCS curves (G) to a two-component model. For H and I, error bars represent standard deviation. (I) Dc of the fast-diffusing component estimated from FCS curves (G). (J) Schematic of an embryo with distinct FD, SD, and PG MEG-3 molecules and their median apparent Dc. P granules are in magenta.

