FIGURE 2:
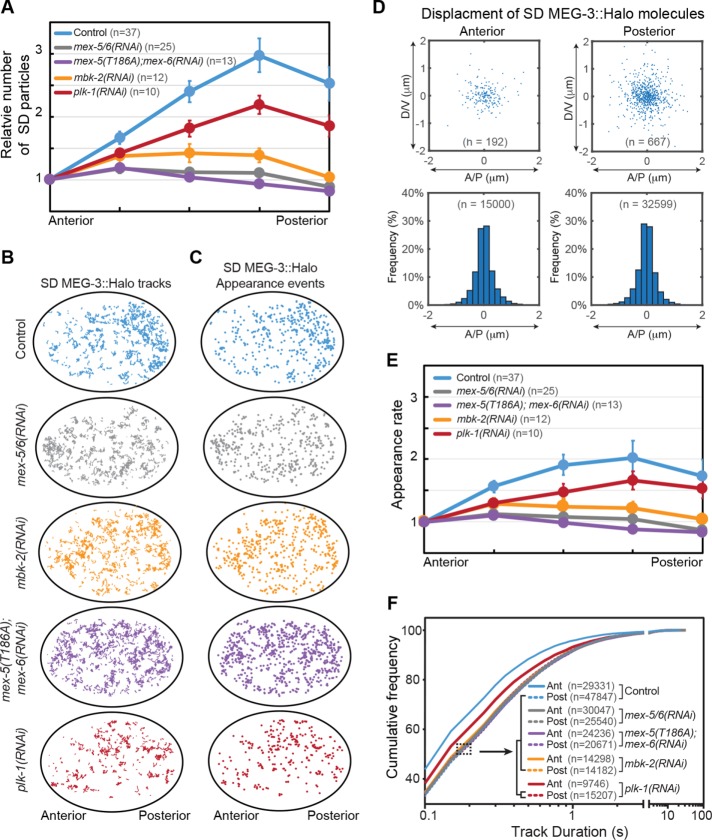
Single-molecule behaviors underlying MEG-3::Halo gradient formation. (A) The number of SD MEG-3::Halo particles across the A/P axis of embryos with the indicated genotype. Particles numbers were normalized to the anterior end and averaged among the indicated number (n) of embryos. Error bars indicate SEM. (B) Tracks of SD MEG-3::Halo molecules in representative embryos of the indicated genotype. Trajectories longer than 250 ms during 10 s acquisitions are shown. (C) Appearance events of SD MEG-3::Halo molecules in embryos of the indicated genotypes. The same embryos were analyzed in B and C. (D) Top, displacement of SD MEG-3::Halo molecules in the anterior and posterior cytoplasm from the embryo in B and C. For each molecule, the appearance position is normalized to the center of the graph and the disappearance position is indicated by a blue dot. Only the displacements of tracks >250 ms are shown. Bottom, frequency of displacements of tracks >250 ms along the A/P axis. Tracks are pooled from 37 embryos (n = total number of tracks analyzed). (E) Average appearance rate of SD MEG-3::Halo particles along the A/P axis. Appearance rate is normalized to the anterior region for each embryo. Note that we cannot directly compare appearance rates between embryos due to variability in Halo labeling and in illumination. The same embryos were analyzed in A, E, and F. n = number of embryos analyzed. Error bars indicate SEM. (F) Cumulative frequency of track durations for the indicated genotypes. Track duration values are pooled from the indicated number embryos in A. n = number of particle tracks analyzed. Note that genotypes within the brackets show similar cumulative frequency distributions.

