FIGURE 4:
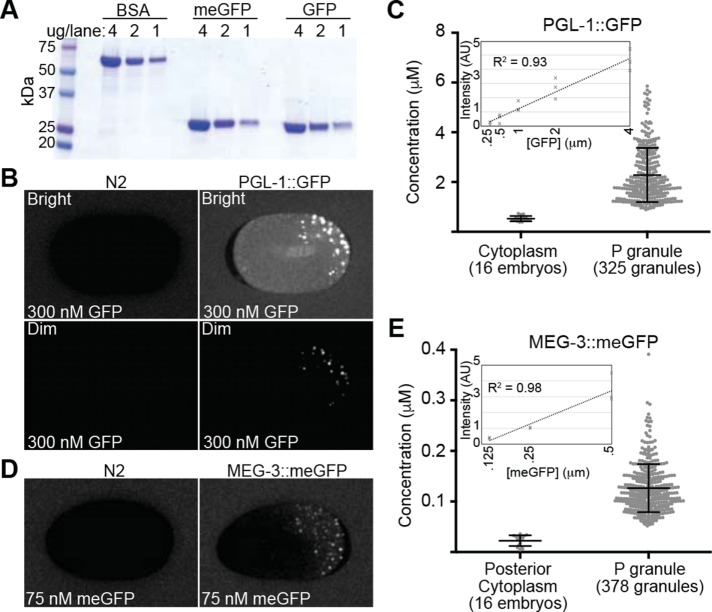
Quantification of MEG-3::meGFP and PGL-1::GFP concentration. (A) Coomassie-stained SDS–PAGE gel of recombinant meGFP and GFP at the indicated concentrations. BSA was used as a loading standard. (B) PGL-1::GFP (right) and N2 (left, no GFP expression) embryos were bathed in 300 nM recombinant GFP. The top images (Bright) were normalized to show the GFP bath and cytoplasmic GFP and include saturated P granule signals. The bottom images (Dim) are normalized so that there are no saturated pixels. (C) Quantification of estimated PGL-1::GFP concentration in the cytoplasm outside of P granules (16 embryos) and in P granules (325 P granules from 16 embryos). Error bars = SD. Inset, fluorescence intensity of different concentration GFP baths in arbitrary units (AU). R2 value for the trendline is indicated. (D) MEG-3::meGFP (right) and N2 (left, no GFP expression) embryos were bathed in 75 nM recombinant meGFP. (E) Quantification of estimated MEG-3::meGFP concentration in the posterior cytoplasm outside of P granules (16 embryos) and in P granules (378 P granules from 16 embryos). Error bars = SD. Inset, fluorescence intensity of different concentration meGFP baths in arbitrary units (AU). R2 value for the trendline is indicated.

