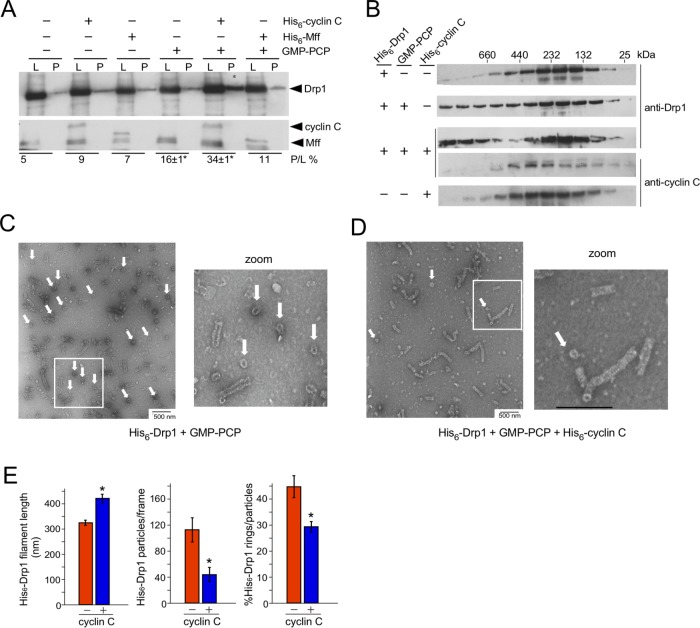
FIGURE 3:
Cyclin C stimulates Drp1 aggregate dissolution and filament formation. (A) Oligomerization was monitored using Western blot analysis of fractions following sedimentation. His6–cyclin C, His6–Mff, and/or GMP–PCP were incubated with His6–Drp1 as indicated and then subjected to high-speed centrifugation. His6–Drp1 and His6–cyclin C in the resulting pellets (P) and the load (L) were visualized by Western blot and then quantified (below each lane) by calculating the ratio of His6–Drp1 in the pellet (P) toy the amount loaded (L). GMP–PCP and GMP–PCP + His6–cyclin C experiments were repeated three times (mean ± SEM; *p < 0.02 from no addition control). (B) Western blot analysis of SEC fractions obtained following incubation of His6–Drp1, His6–cyclin C, or both with or without GMP–PCP. Primary antibodies used are indicated on the right. (C, D) TEM images of His6–Drp1 incubated with GMP–PCP/Mg2+ with or without His6–cyclin C as indicated. White arrows indicate Drp1 rings. (E) Quantitation of Drp1 filament formation from TEM images counting 1485 and 493 particles without and with His6–cyclin C, respectively, across 11 frames of identical magnification. Total particles include filaments and rings. Bars are mean ± SEM. Asterisks indicate p < 0.02.

