Fig. 4.
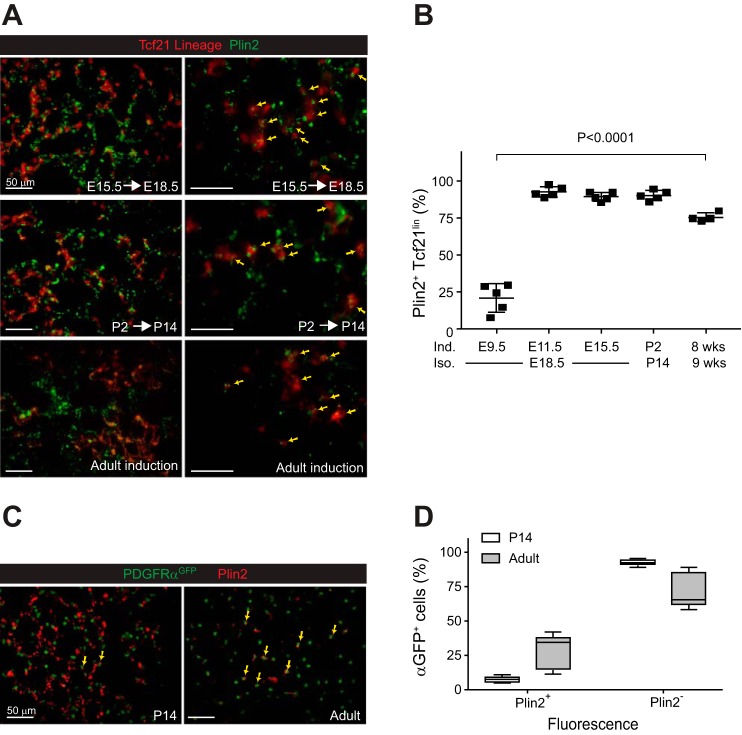
Transcription factor 21 (Tcf21) lineage cells become lipofibroblasts. A: representative images of perilipin 2 (Plin2)-stained lungs from Tcf21mCrem/+;R26RtdT/tdT mice treated with tamoxifen at indicated time points. Yellow arrows indicate cells with overlapping fluorescence; n = 4–5. Scale bars, 50 μm. Adult lungs were isolated 1 wk after a single tamoxifen induction. B: quantification of Plin2+ cells in Tcf21 lineage; n = 4–5, 6–10 fields of view (FOV), one-way ANOVA. Adult lungs were isolated 1 wk after a single tamoxifen induction. E, embryonic day; P, postnatal day; Ind, tamoxifen induction; Iso, lung isolation. C: representative images of Plin2-stained lungs from P14 and adult platelet-derived growth factor receptor-α (PDGFRα)GFP/+ mice. GFP, green fluorescent protein. Yellow arrows indicate cells with overlapping red and green fluorescence; n = 5. Scale bars, 50 μm. D: quantification of Plin2+ cells in PDGFRαGFP+ cells; n = 5, 10 FOV. Data are shown as box and whisker plot with whiskers indicating max/min values.

