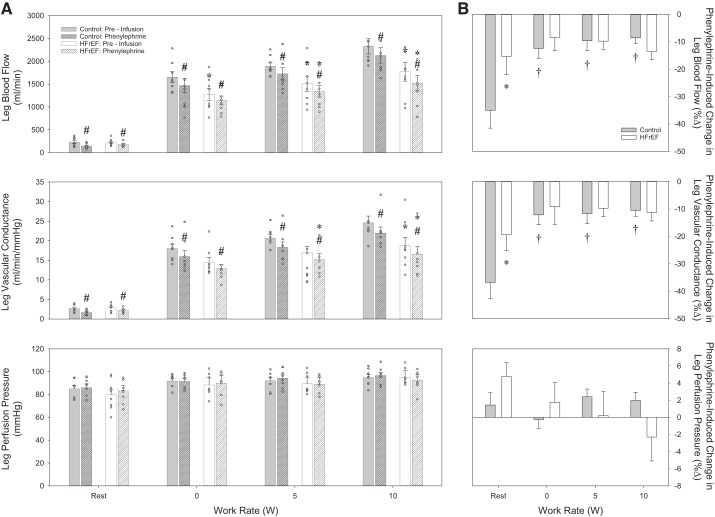
Fig. 4.
α1-Adrenergic agonist drug infusion responses. A: absolute values for leg blood flow (top), leg vascular conductance (middle), and leg perfusion pressure (bottom) in control subjects and heart failure patients with reduced ejection fraction (HFrEF) at rest and during knee-extensor exercise in control conditions (preinfusion) and during phenylephrine infusion. B: percent changes (%Δ) in leg blood flow (top), leg vascular conductance (middle), and leg perfusion pressure (bottom) in response to phenylephrine in control subjects and patients with HFrEF at rest and during knee-extensor exercise. *P < 0.05 vs. control; #P < 0.05 vs. preinfusion; †P < 0.05 vs. rest.

