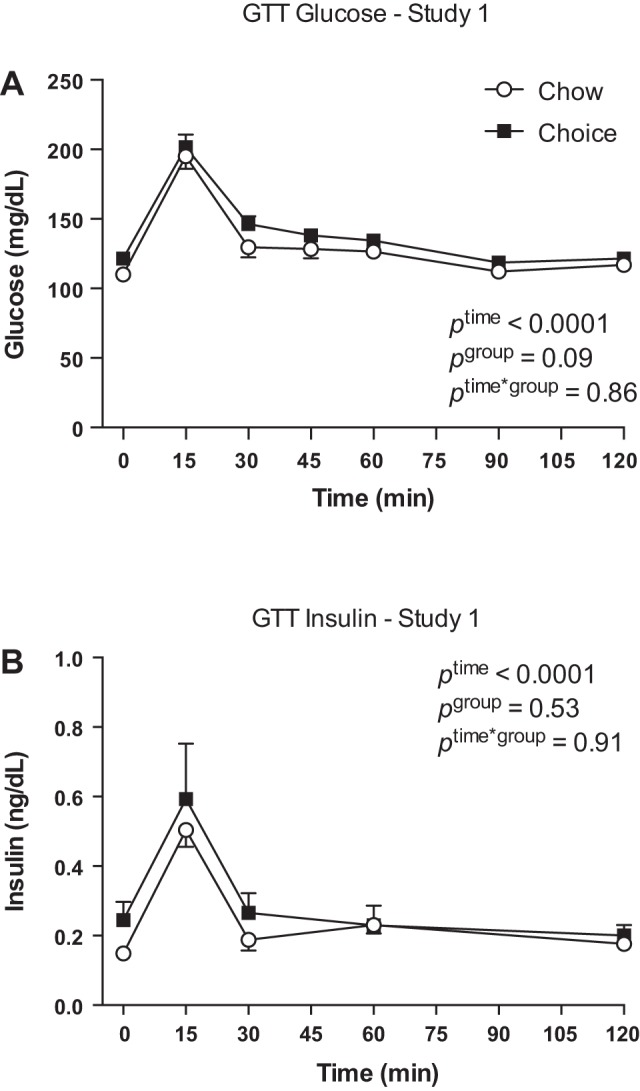
Fig. 2.

Glucose (A) and insulin (B) responses to a glucose tolerance test (GTT) on day 19 of study 1. There were no group differences in glucose and insulin responses to a GTT. Data are means ± SE (A: n = 8 rats/group; B: n = 4 rats in chow group and n = 7 rats in choice group). Two-way ANOVA with repeated measures.
