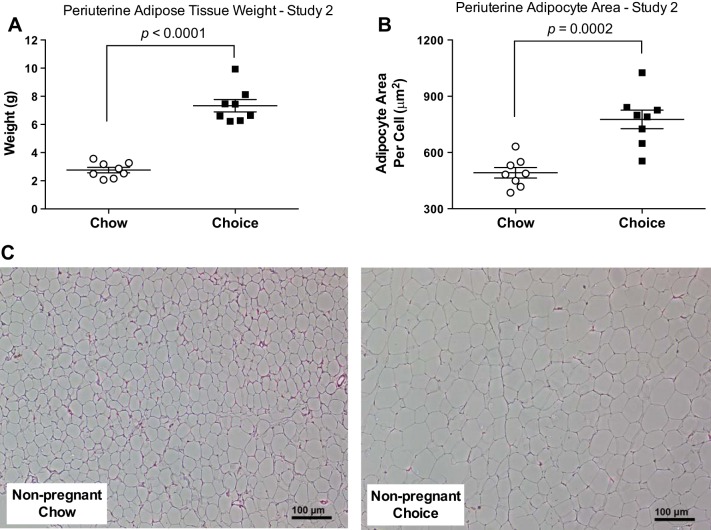
Fig. 5.
Periuterine adipose tissue weight (A), adipocyte area/cell (B), and representative images of histological sections of periuterine adipose tissue (C) in study 2. Periuterine adipose tissue weights were heavier and adipocyte area was larger in choice-diet-fed rats compared with chow-diet-fed rats. Data are means ± SE (n = 8 rats/group). Student’s t-test for A and B.

