Fig. 8.
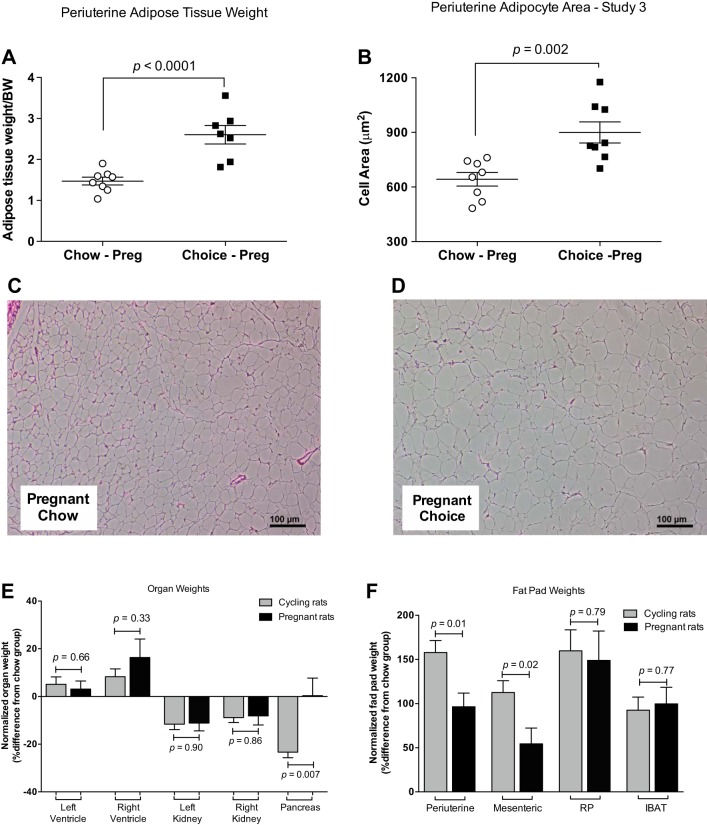
Periuterine fat pad weight (A), adipocyte area/cell (B), representative images of histological sections of periuterine adipose tissue (C, D) in chow and choice pregnant rats, organ weights (E), and fat pad weights (F) of choice rats relative to those of chow rats within cycling (study 2) and pregnant rats (study 3). Periuterine adipose tissue weights were heavier and adipocyte area was larger in pregnant choice-diet-fed rats compared with pregnant chow-diet-fed rats. RP, retroperitoneal; IBAT, intrascapular brown adipose tissue. Data are means ± SE (n = 8 rats/group). Student’s t-test (A and B).

