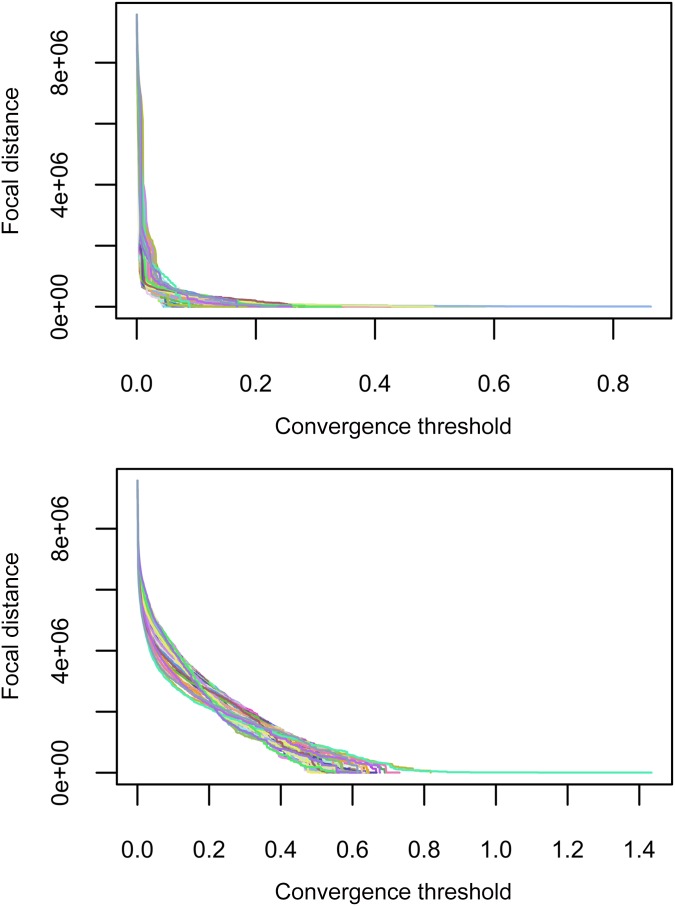
Fig. 3.
Focal distance curves, starting from some of the tracts in the Los Angeles area. Ordinates are focal distances expressed in terms of the aggregated population around the starting point. They represent aggregation sizes at which the corresponding KL trajectories (Fig. 2) converge, for each value of the convergence threshold . We give exemplars of two types of behavior. (Upper) Sharply decreasing curves correspond to points with short focal distances, even for small values of . (Lower) Slower-decreasing curves correspond to points with long focal distances, even for larger values of . The distortion coefficient at a given point in the city is then defined (Eq. 4) to be proportional to the area under the corresponding focal distance curve: The higher the curve, the larger the coefficient.

